Price at 344.98 sits just $1.56 under the 50-SMA, framing that level as the immediate pivot; RSI at 51.61 is neutral but tilting constructive, and MACD at -1.90 versus its signal at -2.81 shows a bullish crossover forming from oversold territory. The 200-SMA at 337.07 provides a clearly defined structural floor, and the trade-quality score of 92.1 alongside profit-probability of 83.0 corroborates a favorable asymmetric setup. However, the technical-inflection score of 59.9 signals the breakout is not yet confirmed — momentum is building but price must reclaim the 50-SMA to validate the long bias.
Wednesday Playbook — Top 5 Setups
The day's five highest-conviction setups, ranked by technical inflection, profit-probability, and trade quality — 5 long, 0 short. Trade your plan and manage risk first. Also screened: $META, $AMZN, $SHOP, $HIMS, $IWM, $QCOM.
Inflection60
Probability83
Quality92
GOOGL is coiling directly at its 50-SMA (346.54) while holding 2.35% above the rising 200-SMA (337.07), setting up a classic mean-reversion inflection where the medium-term trend line is being retested from below.
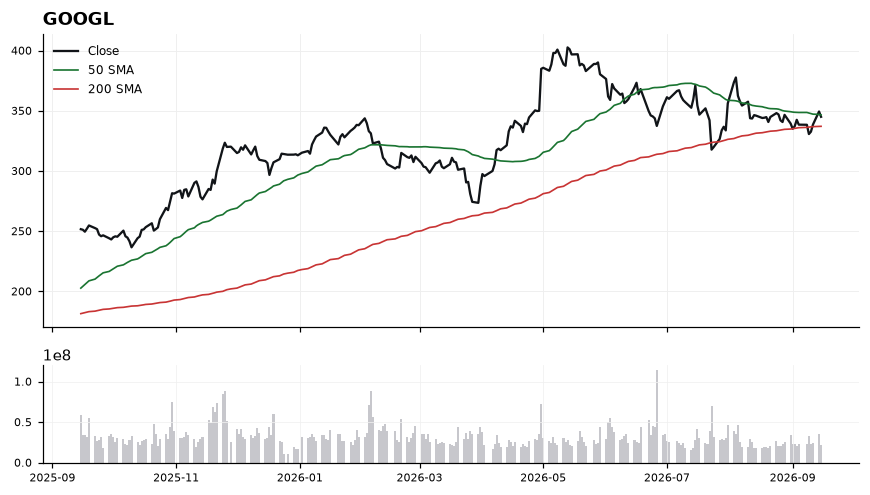
EntryPrimary trigger: reclaim and hold above the 50-SMA at 346.54, entering on strength toward 347.50. Secondary add: pullback into 340.00-341.50 zone with RSI holding above 50.
InvalidationDaily close below 336.50 (just under the 200-SMA at 337.07). A break there invalidates the higher-low structure and signals the medium-term uptrend is failing, likely opening a deeper mean-reversion move.
TargetsFirst target: 355.00 — prior swing resistance and a ~3% extension from the 50-SMA reclaim → Second target: 365.00 — measured move projecting off the 200-SMA base
TimeframeSwing (2-6 weeks)
Inflection67
Probability64
Quality89
AMAT is retesting its rising 200-SMA at 413.66 after a sharp pullback from the 509.84 50-SMA, marking a classic long-side inflection with price sitting just 1.82% above the long-term trend line.
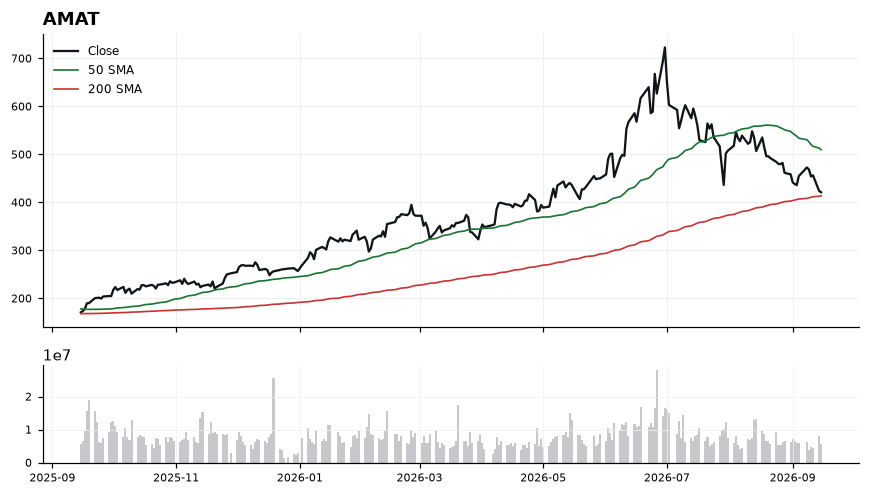
RSI(14) at 34.11 signals a stretched, oversold condition that historically precedes mean-reversion attempts, but MACD at -21.58 below its -19.95 signal line confirms downside momentum has not yet flipped. The 88-point gap between spot (421.17) and the 50-SMA (509.84) underscores how extended the correction has become, while the shallow 1.82% cushion to the 200-SMA makes this level the decisive line-in-the-sand. Trade-quality (89.4) and technical-inflection (67.1) scores support a constructive stance, but confirmation of an RSI turn and MACD cross is still pending.
EntryStagger entries on strength: initial tranche 418-425 on a reclaim/hold of the 200-SMA (413.66); add on a momentum trigger above 435 with RSI crossing back over 40.
InvalidationDaily close below 405 invalidates the setup — it would breach the 200-SMA support, confirm trend loss, and open risk toward the low-390s.
TargetsFirst target 465 (mid-gap fill between spot and the 50-SMA) → Second target 508-512 (retest of the 50-SMA at 509.84)
TimeframeSwing (3-6 weeks)
Inflection65
Probability64
Quality89
LRCX is testing its rising 200-SMA at 265.40 from above while trading well below the 50-SMA at 311.10, creating a classic pullback-to-trend inflection where the working long bias must be defended at the long-term moving average.
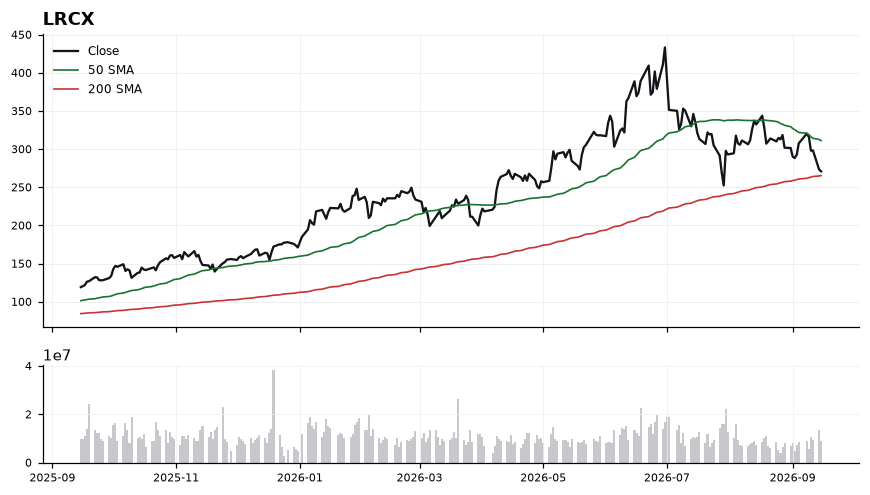
Price at 270.87 sits just 2.06% above the 200-SMA (265.40), with RSI(14) at 36.51 signaling oversold conditions but not yet washout territory. MACD at -8.09 remains below its signal at -5.12, confirming momentum is still negative and any long entry is counter-trend to the short-term slope. The 50-SMA at 311.10 is now overhead resistance roughly 15% away, framing the recovery ceiling, while the 200-SMA acts as the pivot line separating a constructive higher-low setup from trend failure.
EntryStaged entry: initial tranche at 268-271 on stabilization above the 200-SMA (265.40); add on reclaim/close back above 278 to confirm momentum turn.
InvalidationDaily close below 261.50 (roughly 1.5% under the 200-SMA); breaking it invalidates the trend-support thesis and opens risk of a deeper mean-reversion leg toward the low-250s.
TargetsFirst target 295.00 — mid-gap between current price and the 50-SMA, prior consolidation shelf → Second target 311.00 — direct test of the declining 50-SMA at 311.10
TimeframeSwing (2-6 weeks)
Inflection63
Probability69
Quality85
IBIT is trading at 43.11, holding above both its 50-SMA (39.21) and 200-SMA (42.20), with the long-term trend line just 2.15% below acting as a critical pivot. The setup is at an inflection because MACD (1.50) has crossed below its signal (1.81) even as RSI (54.20) remains constructive — a momentum cooldown inside an intact uptrend.
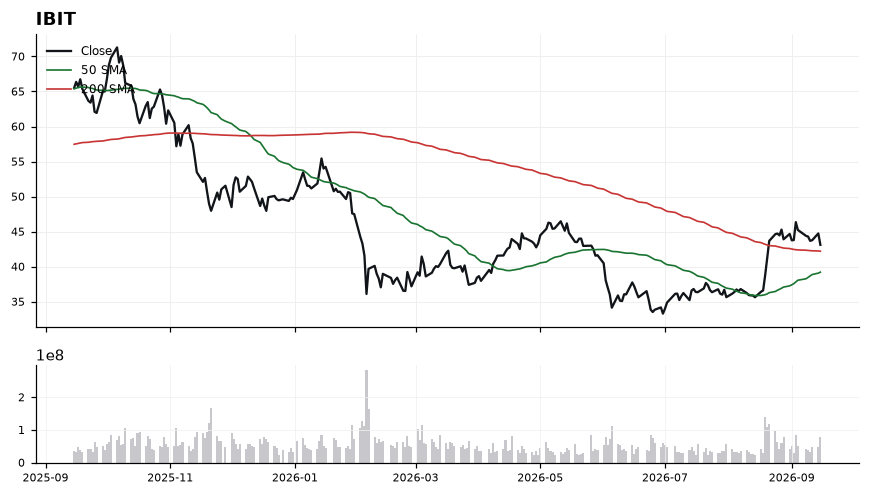
Price sitting 9.9% above the 50-SMA and just 2.15% above the 200-SMA signals a mature leg where mean-reversion risk to the 42.20 zone is elevated. The MACD bearish crossover (1.50 vs 1.81) is the first evidence of waning upside thrust, but RSI at 54.20 is neutral-constructive and shows no distribution yet. The 50-SMA at 39.21 marks the deeper trend anchor, while the 200-SMA at 42.20 is the immediate line separating trend continuation from a regime shift. Trade-quality score of 85.2 with profit-probability of 69.0 supports a disciplined long bias, but the softening MACD argues for staged entries rather than chasing.
EntryPreferred accumulation zone 42.20-42.60 on a pullback to the 200-SMA; secondary trigger on a reclaim and hourly close back above 43.50 if momentum re-accelerates.
InvalidationDaily close below 41.60 (roughly 1.4% under the 200-SMA). A break there invalidates the reclaim thesis and opens a retest of the 50-SMA at 39.21.
TargetsFirst target 45.20 — prior swing extension and measured move from the 50/200-SMA base → Second target 47.00 — trend-extension objective if MACD re-crosses above signal
TimeframeSwing (2-6 weeks)
Inflection65
Probability69
Quality80
CRCL trades at 86.30, hovering just 0.66% above its rising 200-SMA (85.74) while sitting well above the 50-SMA (75.41) — a classic reclaim-and-retest inflection where the long-term trendline is being tested as support.
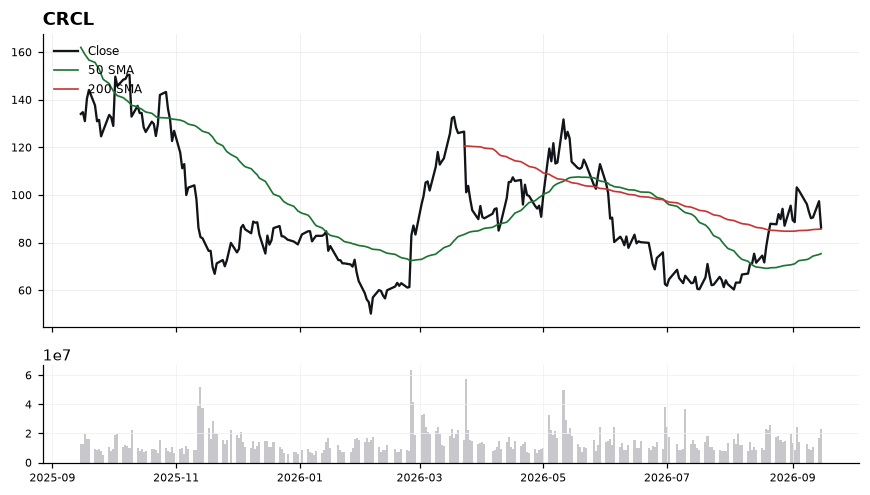
Price recently pushed back above the 200-day (85.74), converting prior resistance into a live support test, while the 50-SMA at 75.41 slopes upward and confirms the shorter-term uptrend. RSI at 49.88 sits neutral, leaving room to expand in either direction without overbought risk. However, MACD (4.81) has crossed below its signal (5.84), a near-term momentum warning that argues for confirmation before sizing up, and helps explain the pause at the 200-SMA.
EntryTiered: initial probe on a hold of 85.74–86.30 (200-SMA reclaim confirmation); add on a reclaim of the MACD signal with price closing above 88.00.
InvalidationDaily close below 84.50 — a decisive break of the 200-SMA (85.74) invalidates the reclaim thesis and reopens downside toward the 50-SMA at 75.41.
Targets92.00 — first supply zone and MACD-recovery objective → 98.50 — extension target as RSI expands toward the 60–65 momentum band
TimeframeSwing (2-6 weeks)
Ranked by technical inflection, profit-probability, and trade quality. Educational only. Not financial advice.