Price sits 3.98% above the 200-SMA and roughly 7.8% above the 50-SMA, evidencing a healthy uptrend now that the 50-SMA has recaptured the 200-SMA proximity. MACD at 14.02 versus signal 4.14 shows a wide, positive spread — momentum is firmly with the bulls. RSI at 67.18 is strong but sits just below the 70 overbought threshold, leaving limited buffer before mean-reversion risk rises. The structural bias remains long as long as price holds above the 200-SMA at 623.23.
Sunday Playbook — Top 5 Setups
The day's five highest-conviction setups, ranked by technical inflection, profit-probability, and trade quality — 5 long, 0 short. Trade your plan and manage risk first. Also screened: $IBIT, $CVNA, $AAOI, $SPY, $AMZN, $SHOP.
Inflection60
Probability78
Quality91
META trades at 648.03, extended above both the 50-SMA (600.90) and 200-SMA (623.23) with a confirmed bullish MACD posture, placing the stock at a continuation inflection where trend followers must decide between chasing strength or waiting for a pullback.
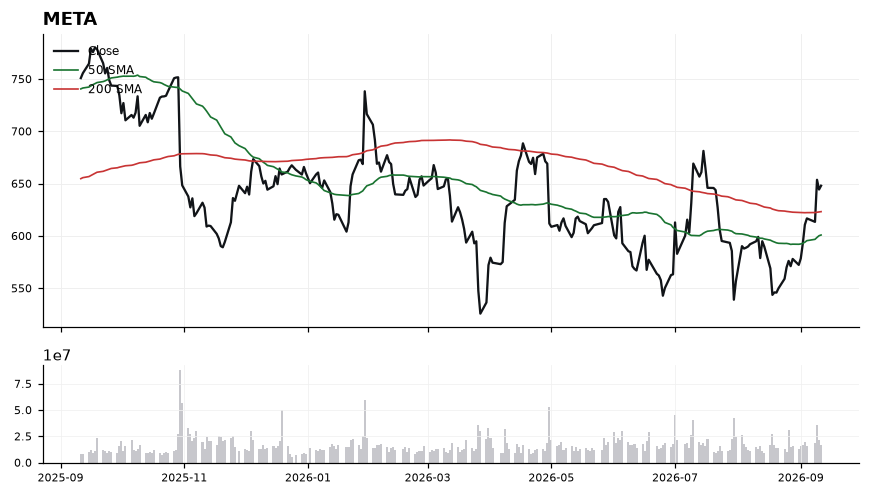
EntryPreferred: staggered longs on a pullback into 630–635 (near-term demand shelf above the 200-SMA). Alternative trigger: breakout and hold above 655 on strong closes.
InvalidationDaily close below 622 (loss of the 200-SMA at 623.23), which would invalidate the trend structure and signal a shift back toward the 600.90 50-SMA.
TargetsFirst target: 668–672 (measured continuation from the current MACD impulse) → Second target: 690 (extension objective if RSI momentum sustains above 65)
TimeframeSwing (2-6 weeks)
Inflection75
Probability64
Quality86
TXRH is testing its 200-SMA (180.01) from above with price at 181.22, just 0.67% above this long-term trend anchor while RSI(14) at 28.58 signals deeply oversold conditions. This confluence of oversold momentum at critical trend support marks a potential technical inflection for the Long bias.
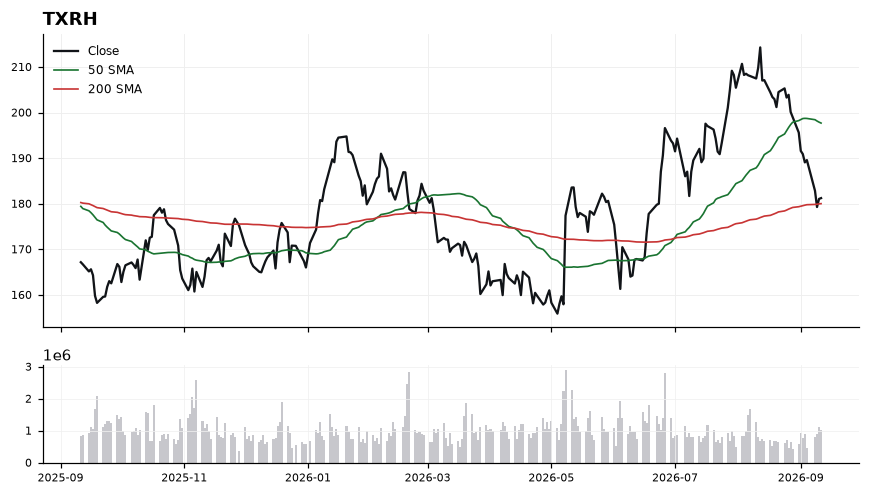
Price at 181.22 is trading well below the 50-SMA at 197.68 (roughly 8.3% below) but is pressed directly against the 200-SMA at 180.01, the last major trend defense. RSI at 28.58 is in oversold territory, historically a zone where mean-reversion attempts develop, though MACD at -5.22 versus signal -2.83 confirms downside momentum is still active and unturned. The setup is a classic 'reaction zone' test: oversold into major support, but without a momentum crossover yet, requiring confirmation before commitment.
EntryStaged entry: initial tranche 180.50-181.50 while price holds the 200-SMA; add on reclaim confirmation above 184.00 with an intraday close.
InvalidationInvalidation on a daily close below 177.50 (roughly 1.4% under the 200-SMA), which would signal a decisive loss of the long-term trend support and open the path to deeper downside.
TargetsFirst target 191.00 (mid-gap toward the 50-SMA, mean-reversion bounce zone) → Second target 197.68 (200-SMA reclaim leading to a full retest of the 50-SMA)
TimeframeSwing (2-6 weeks)
Inflection69
Probability69
Quality86
ASAN is coiling right at its 200-SMA (8.74) with price at 8.77, sitting at a decision point where the trend regime flips bull or bear. With a trade-quality score of 86.4 and technical-inflection of 68.6, the long bias is justified but requires confirmation given MACD (0.04) has crossed below signal (0.25).
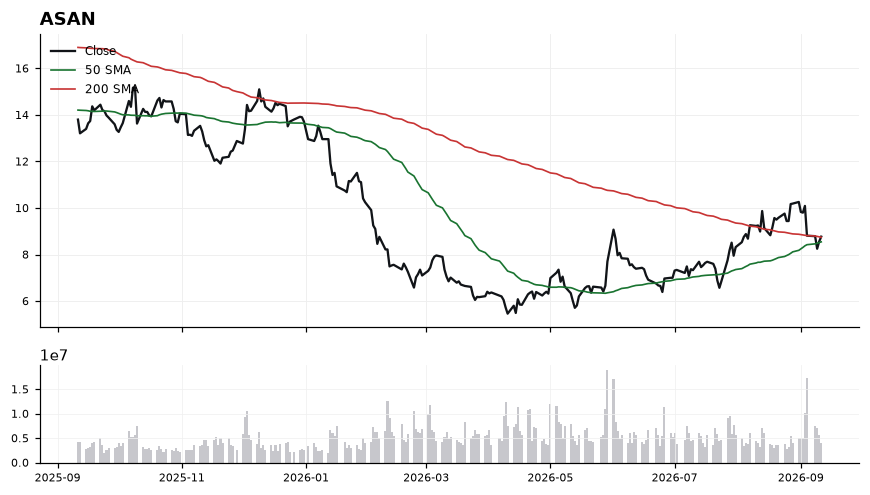
Price is 0.29% above the 200-SMA (8.74) and comfortably above the rising 50-SMA (8.54), preserving a constructive structure. However, RSI at 46.4 is sub-50 and MACD trailing its signal line (0.04 vs 0.25) confirms near-term momentum has cooled into the retest. The 50-SMA at 8.54 is the key higher-low reference; holding the 8.54–8.74 shelf keeps the long thesis intact, while reclaiming momentum above 8.90 would signal buyers regaining control.
EntryTactical entry on a reclaim/hold of the 200-SMA in the 8.74–8.80 zone, or a pullback into 8.55–8.60 near the 50-SMA; confirmation trigger on a close back above 8.90.
InvalidationInvalidation on a daily close below 8.45 (under the 50-SMA), which would break the higher-low structure and flip the moving-average stack bearish.
Targets9.20 — prior resistance and momentum reset zone → 9.60 — measured extension if MACD recrosses higher
TimeframeSwing (2-6 weeks)
Inflection63
Probability69
Quality93
GOOGL is coiling directly on top of its 200-SMA at 336.81 with price at 338.50, offering a high-quality risk-defined long setup as the stock tests structural support while trading below a declining 50-SMA at 347.18.
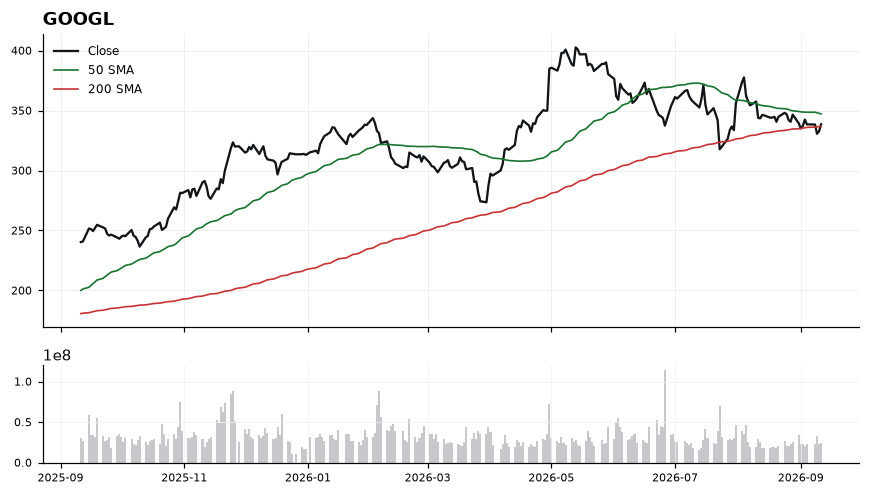
Price sits just 0.50% above the 200-SMA (336.81), making that line the pivotal line-in-the-sand for the medium-term uptrend. RSI at 46.79 is neutral-to-soft, signaling momentum reset rather than breakdown, while MACD at -3.61 below its -3.18 signal confirms short-term downside pressure has not yet exhausted. The 50-SMA at 347.18 now acts as immediate overhead resistance and the key line to reclaim to confirm a bullish inflection. With trade-quality scoring 93.3 and profit-probability 69.0, the reward-to-risk framing is favorable so long as the 200-SMA holds on a closing basis.
EntryStagger entries between 336.80-339.50, with an add-on trigger on a reclaim and close above the 50-SMA at 347.18
InvalidationDaily close below 333.50 (roughly 1% under the 200-SMA); losing this level breaks the medium-term trend structure and invalidates the mean-reversion long thesis
TargetsFirst target 347.20 at the 50-SMA where sellers are likely to defend → Second target 355.00-358.00 on MACD bullish crossover and RSI reclaim of 55
TimeframeSwing (2-6 weeks)
Inflection45
Probability93
Quality80
QCOM is trending above both the 50-SMA (168.60) and 200-SMA (168.10), which are tightly stacked and now serving as a converged support shelf roughly 8.25% below spot. Price at 181.97 with MACD (2.56) well above signal (0.27) marks a momentum inflection, though RSI at 66.29 signals the tape is approaching overbought.
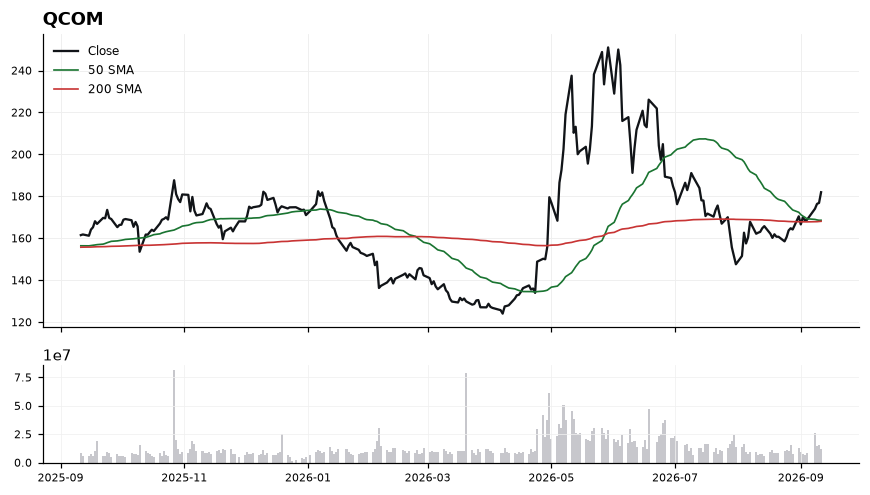
The 50/200 SMA cluster near 168 forms a well-defined structural base, and the wide MACD spread of +2.29 confirms trend acceleration rather than exhaustion. RSI at 66.29 is strong but not yet stretched past 70, leaving modest room before momentum risk elevates. The 8.25% extension above the 200-SMA reflects a healthy but no longer early-stage move, arguing for disciplined entries rather than chase-buying. Trade-quality (79.6) and profit-probability (93.0) support the long bias, while inflection score (44.9) tempers urgency.
EntryPreferred accumulation on pullback into 175.00-177.50; breakout add-on above 183.50 on expanding momentum.
InvalidationDaily close below 172.00 invalidates the setup by breaching near-term structure and threatening a retest of the 168 SMA confluence.
Targets188.50 as initial measured extension of current thrust → 195.00 as secondary objective on continuation
TimeframeSwing (2-6 weeks)
Ranked by technical inflection, profit-probability, and trade quality. Educational only. Not financial advice.