Price is pinned inside a narrow 4.5-point band defined by the 200-SMA floor at 167.92 and the 50-SMA ceiling at 172.40, making this a classic mean-reversion decision zone. The MACD bullish cross beneath the zero line, paired with RSI reclaiming the mid-50s, points to improving momentum but not yet a confirmed trend. The fact that the 50-SMA remains above the 200-SMA preserves the broader uptrend structure, while the shallow 1.53% cushion to the 200-SMA leaves little room for error on the downside. A decisive close through 172.40 would flip the near-term posture from range-bound to breakout.
Monday Playbook — Top 5 Setups
The day's five highest-conviction setups, ranked by technical inflection, profit-probability, and trade quality — 4 long, 0 short. Trade your plan and manage risk first. Also screened: $GLW, $SOXL, $GOOGL, $VRT, $COST, $FIG.
Inflection66
Probability83
Quality90
QCOM is coiling between its 50-SMA (172.40) resistance and 200-SMA (167.92) support, with price at 170.48 sitting just 1.53% above the long-term trend line. The setup qualifies as an inflection because MACD (-1.71 vs signal -3.46) has crossed higher while RSI at 55.78 shows momentum rebuilding without being overbought.
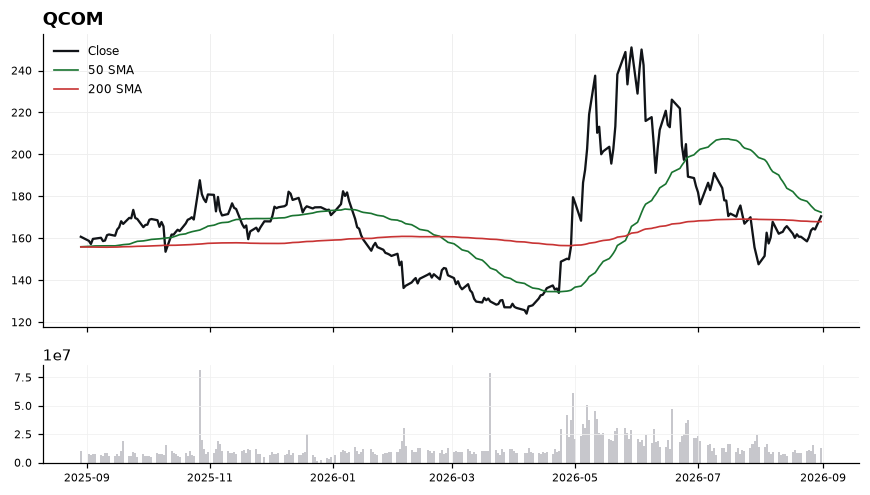
EntryPreferred accumulation zone 168.50-170.50 on a pullback that holds the 200-SMA; alternatively, a breakout trigger on a close above 172.40 (the 50-SMA) to confirm momentum takeover.
InvalidationInvalidation on a daily close below 166.50, which would break the 200-SMA support at 167.92 and negate the long thesis by signaling a trend regime shift.
TargetsFirst target 175.50, reclaiming prior swing area above the 50-SMA → Second target 180.00, a round-number extension roughly 7% above the 200-SMA
TimeframeSwing (2-6 weeks)
Inflection63
Probability83
Quality86
CVNA is trading at 73.46, just 0.85% above its 200-SMA (72.84) and well clear of the 50-SMA at 68.20, marking a golden-cross regime where the stock is testing whether the long-term trendline flips from ceiling to floor.
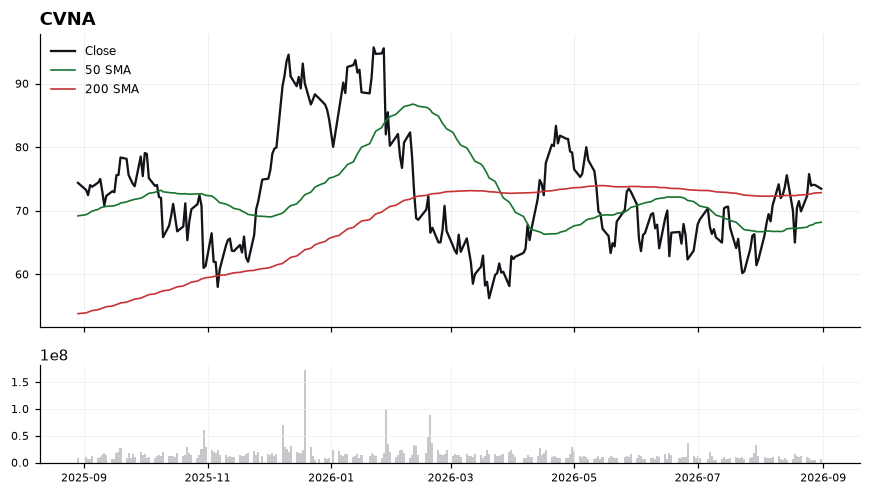
Price sits above both the 50-SMA (68.20) and 200-SMA (72.84), with the 50 tracking below the 200 — a constructive but still-maturing structure. RSI at 55.12 shows positive momentum without stretched conditions, leaving room to run before overbought. MACD at 1.70 above signal 1.51 confirms momentum expansion, though the narrow spread suggests the move is early rather than exhausted. The tight 0.85% distance to the 200-SMA makes this a classic decision zone: hold above and trend continuation is favored, fail and the tape reverts back to the 50-SMA.
EntryPreferred accumulation on constructive holds of the 72.84 (200-SMA) shelf, ideally 72.80–73.50; momentum add-on trigger on a decisive reclaim/close above 74.50.
InvalidationInvalidation on a sustained close below 71.50, which would break the 200-SMA hold and reopen a drift toward the 50-SMA at 68.20.
TargetsFirst target 77.50, extending the current MACD impulse off the 200-SMA reclaim → Second target 81.00, a measured move if momentum broadens and RSI pushes into the 60s
TimeframeSwing (2-6 weeks)
Inflection66
Probability69
Quality90
AVGO is coiling right on its 200-day SMA (369.48) with price at 370.34, a classic long-bias inflection where trend support is being tested after a pullback from the 50-day at 385.29. With trade-quality scoring 90.4 and profit-probability at 69.0, the risk/reward geometry is defined but not yet triggered.
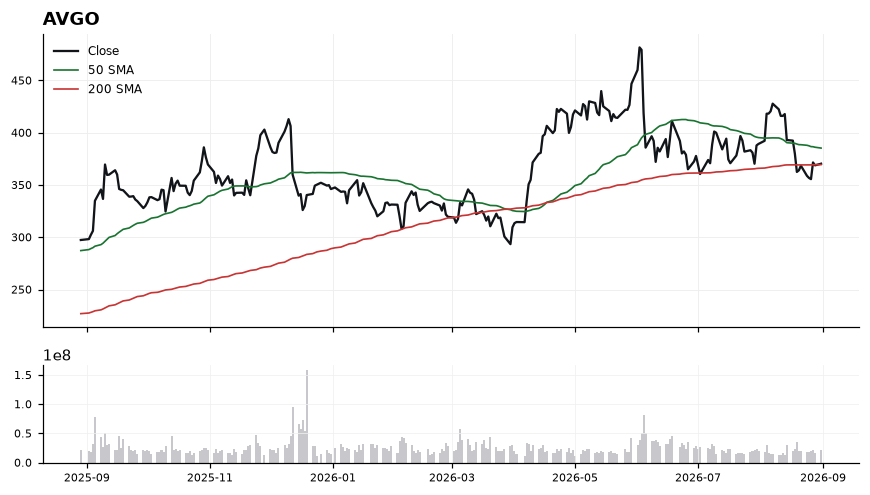
Price sits just 0.23% above the 200-SMA, meaning the primary trend line is the line in the sand — hold it and dip-buyers get a low-risk entry, lose it and the structure flips. RSI at 43.64 is neutral-to-soft, leaving room to rally without being overbought, while MACD at -8.42 below its -5.99 signal confirms momentum has not yet turned. The 50-SMA at 385.29 has rolled over into overhead resistance, capping the first leg of any bounce. Net: constructive base-building at trend support, but confirmation is still pending a momentum cross.
EntryStagger accumulation in the 369–372 zone on a hold of the 200-SMA, with an add-on trigger above 378 to confirm reclaim of the mid-range.
InvalidationDaily close below 362 invalidates the setup — that would mark a decisive loss of the 200-SMA (369.48) and shift the intermediate trend from support-test to breakdown.
Targets385 — reversion to the 50-SMA at 385.29, first supply zone → 398–402 — extension above the 50-SMA on a MACD bullish cross
TimeframeSwing (2-6 weeks)
Inflection61
Probability78
Quality83
IBIT is extended at 44.67, roughly 4.9% above its rising 200-SMA (42.58) and ~20% above the 50-SMA (37.26), with momentum stretched into an overbought zone. This is an inflection because trend structure remains constructive while RSI at 72.9 argues for a pause or pullback before the next leg.
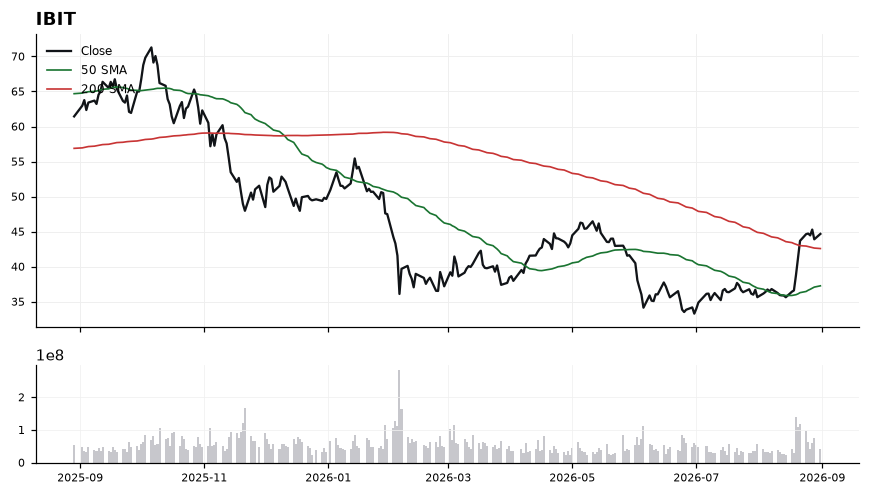
The 50-SMA (37.26) has cleared the 200-SMA (42.58) and price sits above both, confirming a bullish regime. MACD at 2.25 vs signal 1.57 shows momentum still expanding, but RSI(14) at 72.89 signals overbought conditions that historically precede consolidation. The 4.9% cushion over the 200-SMA is modest enough that a mean-reversion move toward 42.58 would not damage the primary trend, making a chase here lower quality than a pullback entry.
EntryPrefer a pullback zone of 42.60–43.50 (retest of the 200-SMA and prior breakout shelf); alternatively, a momentum re-trigger only on a decisive daily close above 45.00 with MACD holding above signal.
InvalidationDaily close below 41.80 (under the 200-SMA at 42.58 with buffer); a break there flips the trend structure and would invalidate the bullish inflection thesis.
TargetsFirst target 47.50 (measured extension from the 50/200 base) → Second target 50.00 psychological round-number and trend-projection objective
TimeframeSwing (2-6 weeks)
Inflection56
Probability83
Quality84
HIMS is coiling between its rising 200-SMA (28.55) and falling 50-SMA (31.99), sitting just 3.59% above long-term trend support — an inflection zone where a Long bias is defensible but not yet confirmed.
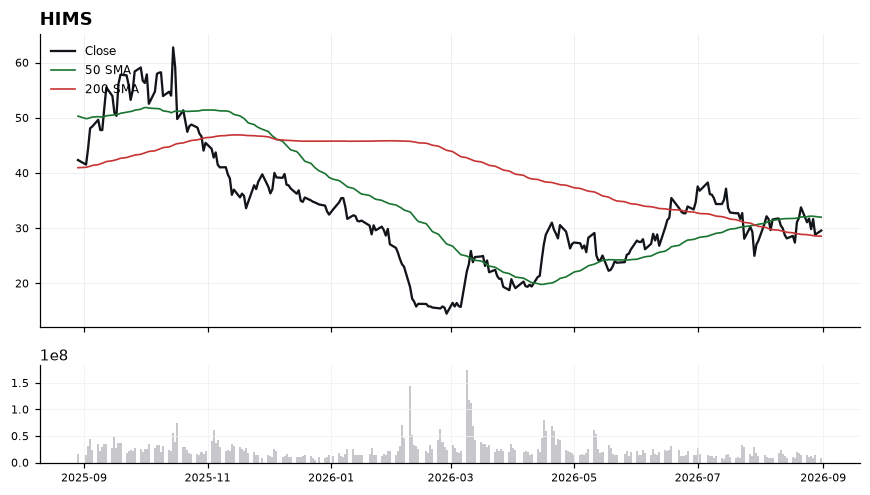
Price at 29.58 trades below the 50-SMA (31.99) but holds above the 200-SMA (28.55), keeping the longer-term uptrend structure intact. RSI at 47.49 is neutral with a slight downward lean, while MACD at -0.21 is flat against its signal at -0.21 — momentum is coiled, not directional. The 50/200-SMA gap of ~3.44 points defines the compression range, and a resolution through either boundary should set the next leg. Until then, the tape favors mean-reversion trades off the 200-SMA rather than trend-chasing.
EntryPreferred accumulation zone 28.60–29.20 on a hold of the 200-SMA (28.55); alternatively, a momentum trigger on a reclaim and close above 30.20 opens the path back toward the 50-SMA.
InvalidationDaily close below 27.90 invalidates the setup — it would break the 200-SMA support, flip the long-term trend context, and negate the Long working bias.
TargetsFirst target 31.99 (test of the 50-SMA and upper range boundary) → Second target 33.80 (extension above the 50-SMA on a confirmed momentum breakout)
TimeframeSwing (2-6 weeks)
Ranked by technical inflection, profit-probability, and trade quality. Educational only. Not financial advice.