Price is essentially pinned to the 50-SMA and sits only 0.89% above the rising 200-SMA at 71.29, keeping the longer-term structure constructive. RSI(14) at 54.91 is neutral-to-firm with room to expand before overbought conditions, while MACD at 0.82 versus a signal of -0.33 confirms positive momentum crossover. Together, the flat short-term MA and rising long-term MA with bullish MACD argue for an upward resolution, though the thin 0.89% cushion to the 200-SMA leaves little margin for error.
Monday Playbook — Top 5 Setups
The day's five highest-conviction setups, ranked by technical inflection, profit-probability, and trade quality — 3 long, 0 short. Trade your plan and manage risk first. Also screened: $FIG, $BMNR, $CRCL, $VRT, $SOXL, $NVDA.
Inflection62
Probability98
Quality80
CAVA is coiling right at its 50-SMA (71.90) with price at 71.93 and the 200-SMA just below at 71.29, framing a tight inflection where a directional resolution is imminent.
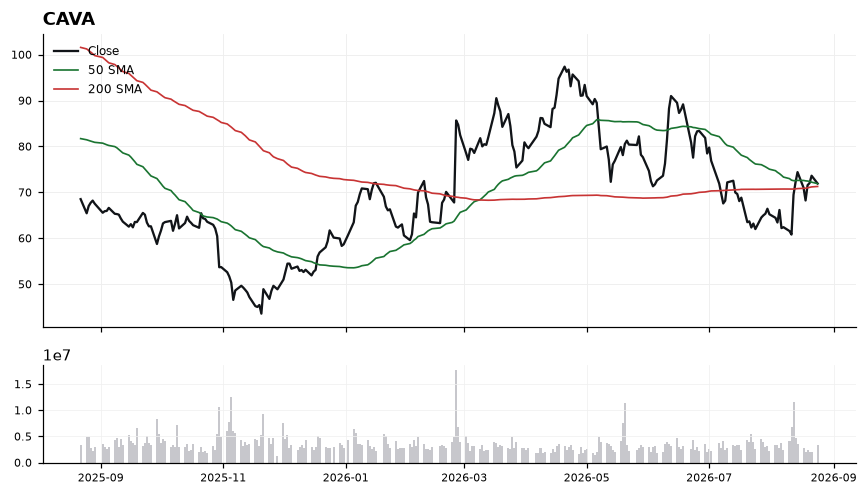
EntryConsider staged entries on a reclaim/hold above 72.00–72.30, or on a controlled pullback into the 71.30–71.60 zone that defends the 200-SMA.
InvalidationA decisive close below 71.00 would break both the 200-SMA (71.29) and the recent base, invalidating the long bias and signaling momentum failure.
TargetsFirst target 74.00, a measured move above the 50-SMA reclaim → Second target 76.50, extension objective if momentum broadens
TimeframeSwing (2-6 weeks)
Inflection71
Probability78
Quality84
IBIT is extended above both moving averages with price at 44.64 sitting 3.97% above the rising 200-SMA (42.93) and roughly 22% above the 50-SMA (36.46). Momentum has surged to an inflection where trend strength and overbought conditions collide, forcing a decision between continuation and mean reversion.
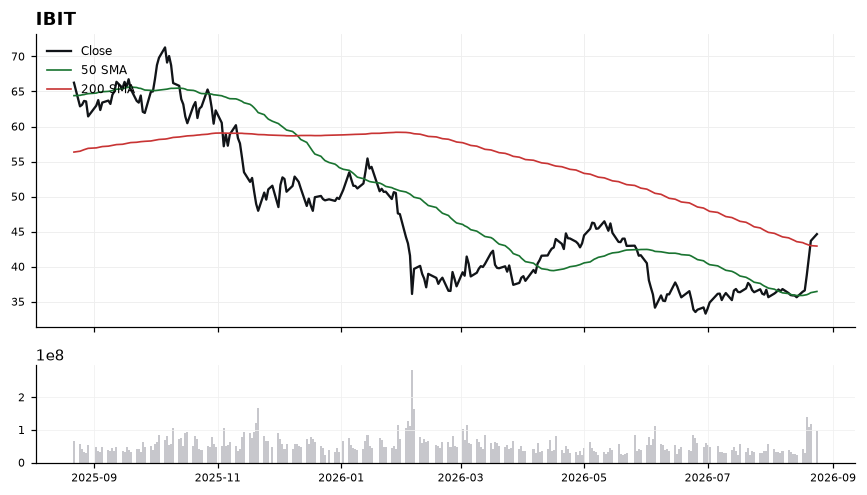
RSI(14) at 81.22 is deeply overbought, historically consistent with strong trends but also elevated pullback risk. MACD at 1.39 versus signal 0.47 shows a wide positive spread, confirming accelerating upside momentum with no divergence yet. Structurally, the 50-SMA has crossed above the 200-SMA and price is riding well above both, leaving the 200-SMA at 42.93 as the key trend pivot and the 50-SMA at 36.46 as deeper support. With trade-quality at 84 but inflection at 70.6, the tape is strong but stretched — a pullback toward prior breakout levels would offer a cleaner risk profile than chasing here.
EntryPrefer a pullback entry into 42.90–43.50 (retest of the 200-SMA zone at 42.93); alternatively, a momentum trigger on a daily close reclaiming and holding above 45.00 after a shallow consolidation.
InvalidationDaily close below 41.80 invalidates the setup — it would break the 200-SMA support at 42.93 and signal the extended move is rolling over into a deeper mean reversion toward the 50-SMA.
TargetsFirst target 47.50 — measured continuation from current breakout as RSI works off overbought → Second target 50.00 — psychological round-number extension if MACD spread holds
TimeframeSwing (2-6 weeks)
Inflection67
Probability78
Quality85
GLD is in a strong uptrend with price at 426.69, extended well above both the 50-SMA (383.83) and 200-SMA (413.78). The inflection is that RSI at 72.49 signals overbought conditions while MACD (10.70 vs 7.32 signal) remains bullish, creating a tension between trend continuation and pullback risk.
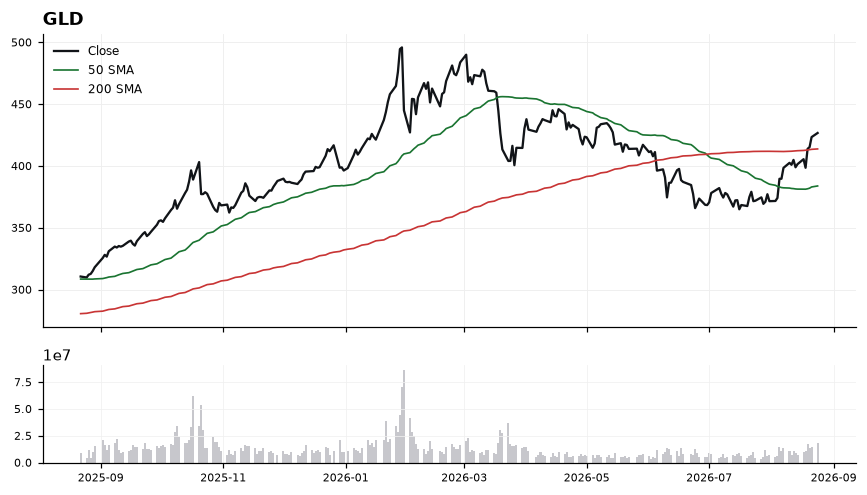
Price sits 3.12% above the 200-SMA and roughly 11% above the 50-SMA, indicating stretched conditions that historically precede consolidation. RSI at 72.49 is in overbought territory, yet MACD momentum remains positive with a widening spread of 3.38 above signal, confirming underlying trend strength. The 50-SMA at 383.83 and 200-SMA at 413.78 define the primary support shelf, while immediate support likely forms near prior consolidation zones between 413-420. Trade-quality scores (84.5) and profit-probability (78.0) are constructive, but the technical-inflection score (67.3) argues for patience rather than chase.
EntryPrefer buying pullbacks into the 418-420 zone (near recent breakout shelf) or a reclaim of 414 (200-SMA area). Avoid chasing above 428 while RSI is stretched.
InvalidationDaily close below 412 invalidates the setup, as it would breach the 200-SMA and signal loss of the intermediate trend structure.
TargetsFirst target 435 (measured continuation from current base) → Second target 445 (trend extension objective)
TimeframeSwing (2-6 weeks)
Inflection61
Probability83
Quality84
GLW trades at 145.55, sitting just 3.28% above its rising 200-SMA at 140.93 while remaining well below the 50-SMA at 173.49 — a classic pullback-into-support setup where a long bias must be defended by the 200-day or the thesis breaks.
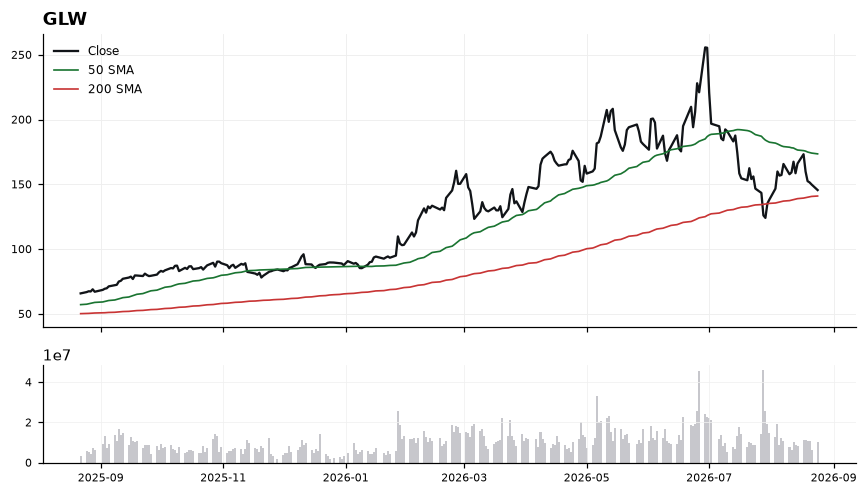
Price is compressed between longer-term trend support (200-SMA 140.93) and a distant mean-reversion magnet (50-SMA 173.49), roughly 19% overhead. RSI at 42.17 is in the neutral-weak zone with room to expand before overbought, and MACD at -3.94 has crossed just above its signal at -4.02, a nascent momentum inflection consistent with the 61.2 inflection score. Trade-quality (84.4) and profit-probability (83.0) skew constructive, but the 50-SMA overhead confirms the broader tape has not yet flipped bullish, so this is a support-reclaim setup, not a breakout.
EntryStaged accumulation zone 142.00–146.00, with confirmation trigger on a daily close back above 148.50 accompanied by MACD extending above signal.
InvalidationDaily close below 139.50; that voids the 200-SMA (140.93) as support and shifts structure to lower-highs/lower-lows, invalidating the long bias.
TargetsFirst target 158.00 (mid-gap between 200-SMA and 50-SMA, prior reaction zone) → Second target 172.00–174.00 (retest of the 50-SMA at 173.49)
TimeframeSwing (2-6 weeks)
Inflection63
Probability83
Quality80
COST is trading at 971.40, above both the 50-SMA (948.14) and 200-SMA (959.44), with the shorter average curling up toward the longer one — a constructive posture that puts price at an inflection point just 1.25% above the 200-day.
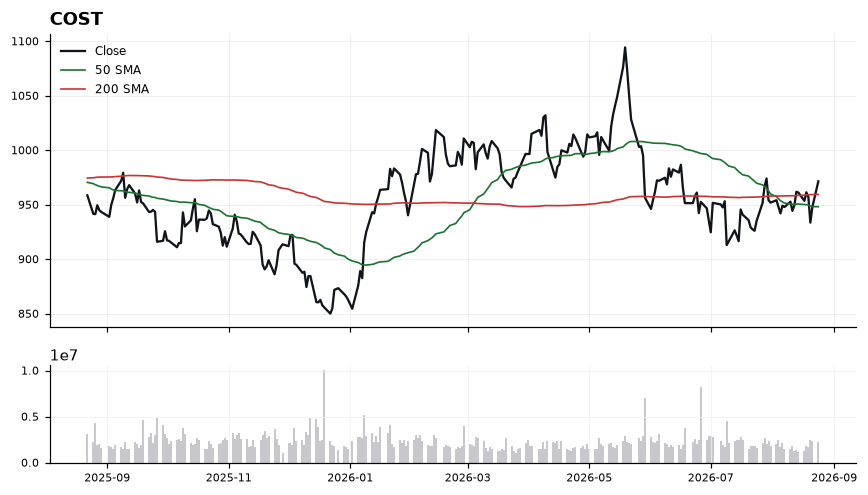
The MACD reading of 2.07 sits meaningfully above its signal at 1.17, indicating momentum has re-accelerated to the upside. RSI at 57.57 is firmly bullish but not yet stretched, leaving room before overbought conditions near 70. Price reclaiming the 200-SMA (959.44) with the 50-SMA (948.14) as a rising floor frames a classic trend-repair setup. The trade-quality score of 80.2 and profit-probability of 83.0 corroborate the constructive technical read.
EntryPreferred accumulation zone 960–965 on pullbacks toward the 200-SMA; alternative momentum trigger on a decisive close above 975.
InvalidationInvalidation on a close below 948 (the 50-SMA); breaking that level would negate the trend-repair thesis and re-open downside toward prior base levels.
TargetsFirst target 992–995 (recent supply shelf) → Second target 1015–1020 (measured continuation)
TimeframeSwing (2-6 weeks)
Ranked by technical inflection, profit-probability, and trade quality. Educational only. Not financial advice.