The tape is neutral-to-constructive: RSI at 53.08 shows balanced momentum with room to expand upward, while MACD at -0.17 versus signal -1.76 marks a decisive bullish crossover from oversold conditions. The 200-SMA (167.83) is now acting as reclaimed support, and the 50-SMA (169.31) is the immediate ceiling that must flip to green-light continuation. With technical-inflection at 67.3 and trade-quality at 84.6, the risk/reward geometry is tight and favorable, but confirmation is still required above the 50-SMA.
Monday Playbook — Top 5 Setups
The day's five highest-conviction setups, ranked by technical inflection, profit-probability, and trade quality — 4 long, 0 short. Trade your plan and manage risk first. Also screened: $IBIT, $GLD, $AMZN, $META, $SPY, $SOXL.
Inflection67
Probability83
Quality85
QCOM is coiling directly at the intersection of its 50-SMA (169.31) and 200-SMA (167.83), with price at 168.74 sitting just 0.54% above long-term trend — a classic decision zone where a small break resolves a large range.
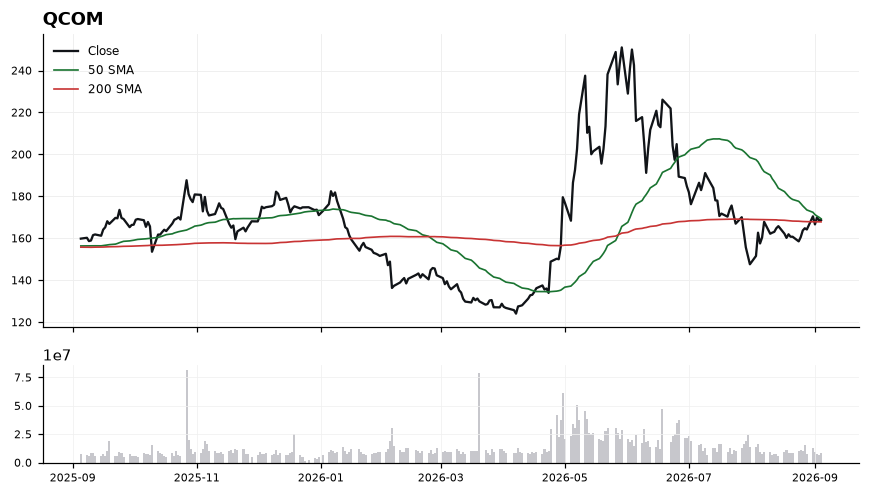
EntryTrigger long on a reclaim and hold above the 50-SMA at 169.31; preferred accumulation zone 168.00–169.30, with add-on above 170.00 on momentum confirmation.
InvalidationInvalidation on a daily close below 167.00 — this would forfeit the 200-SMA (167.83) and negate the MACD-driven bullish inflection, flipping structure back to distribution.
TargetsFirst target 174.50 (prior swing supply and measured move from the SMA compression) → Second target 179.00–180.00 (extended objective on momentum expansion)
TimeframeSwing (2-6 weeks)
Inflection59
Probability83
Quality85
CVNA is trading at 74.59, holding above both the 50-SMA (68.77) and the reclaimed 200-SMA (73.03), placing price at a decision point just 2.14% above its long-term trend line. The MACD (1.54) sits fractionally above its signal (1.53), signaling a fresh but unconfirmed momentum inflection.
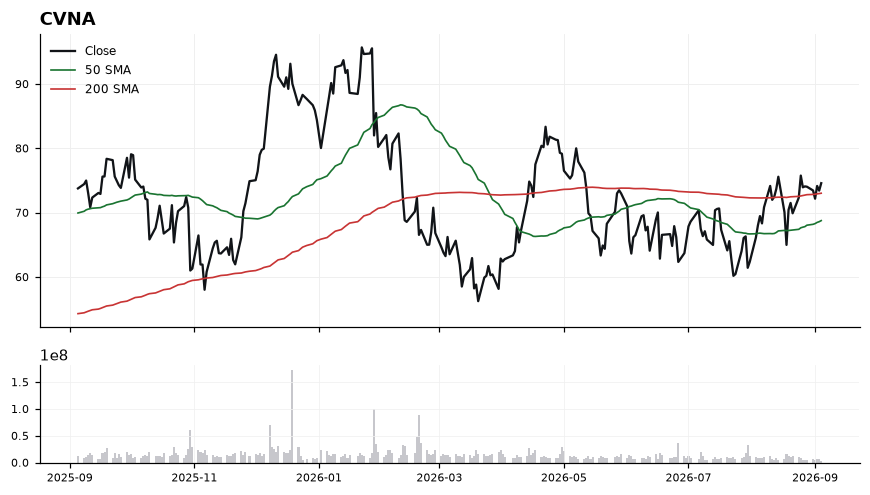
Price structure is constructive: the 50-SMA below the 200-SMA still reflects a base-building phase, but the recent reclaim of the 200-SMA at 73.03 shifts near-term bias higher. RSI at 56.46 is above the mid-line yet well shy of overbought, leaving room to extend before momentum exhaustion. The MACD/signal crossover is razor-thin, so follow-through above 74.59 is required to validate the shift; failure to hold 73.03 would neutralize the setup and put the 50-SMA at 68.77 back in play.
EntryConsider engagement on either (a) a confirmed hold and close above 74.59, or (b) a pullback into the 73.00–73.50 zone that defends the 200-SMA.
InvalidationA decisive close below 72.50 would invalidate the reclaim of the 200-SMA and signal the inflection has failed, opening a retest of the 50-SMA at 68.77.
Targets78.50 — measured extension from the 200-SMA reclaim → 82.00 — prior swing supply and momentum target if RSI pushes toward 65
TimeframeSwing (2-6 weeks)
Inflection63
Probability69
Quality93
GOOGL is compressing between its rising 200-SMA at 335.94 and 50-SMA at 348.57, sitting just 0.75% above long-term trend support — a classic inflection where a MAG7 long thesis is either confirmed by a reclaim or invalidated by a breakdown.
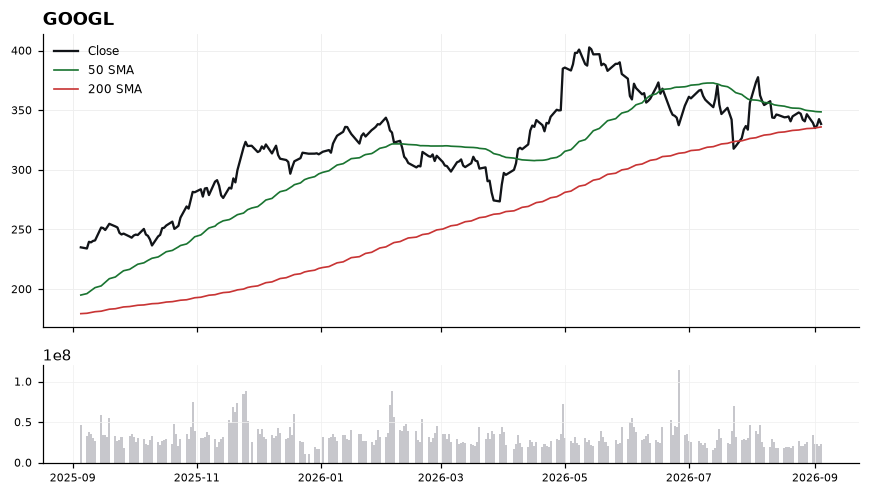
Price at 338.46 is trading below the 50-SMA (348.57) but holding above the 200-SMA (335.94), signaling a short-term pullback within a preserved longer-term uptrend. RSI at 44.82 is neutral-to-soft with room to run before overbought, while MACD at -2.98 below its signal (-2.60) confirms momentum has not yet turned. The narrow 0.75% cushion to the 200-SMA makes this a high-quality risk-defined zone, but tape needs to stabilize before momentum flips constructive.
EntryStagger entries: initial tranche 337.00-339.00 near current price with 200-SMA support at 335.94; add on reclaim of 348.57 (50-SMA) to confirm momentum shift
InvalidationDaily close below 332.00 (roughly 1.2% under the 200-SMA); breach would break the long-term trend structure and invalidate the long bias
TargetsFirst target 348.50 at the 50-SMA — reclaim signals momentum repair → Second target 358.00-360.00, extension zone above the 50-SMA on MACD cross confirmation
TimeframeSwing (2-6 weeks)
Inflection64
Probability78
Quality79
MSTR is trading at 142.80, just 2.67% above its rising 200-SMA (139.09) and well above the 50-SMA (103.50), marking a reclaim attempt of the long-term trend line. With RSI at 66.20 and MACD (9.91) extended above signal (7.20), momentum is confirming but nearing overbought territory, framing an inflection on whether bulls can consolidate the 200-SMA as new support.
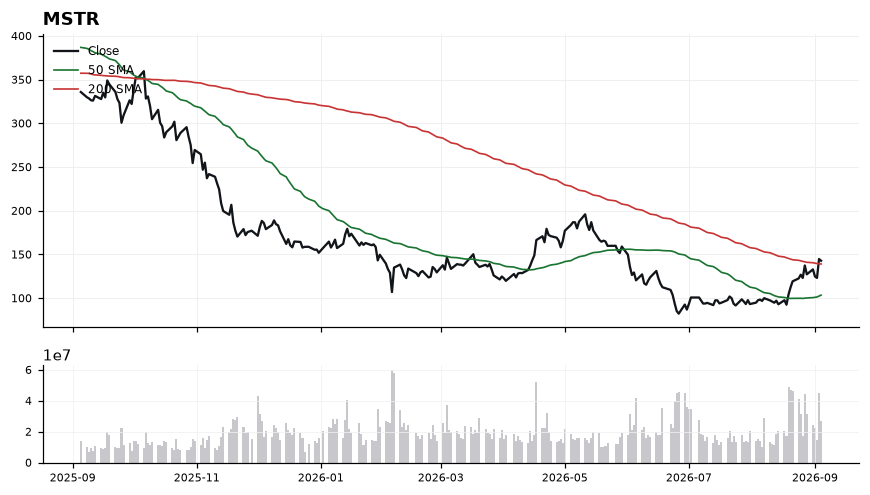
The 50-SMA sitting nearly 34% below spot signals a powerful medium-term uptrend, while price hovering only 2.67% above the 200-SMA shows the long-term regime is still being contested. MACD's positive spread of 2.71 points to sustained upside momentum, but RSI at 66.20 leaves limited runway before overbought conditions typically trigger consolidation. The tape favors continuation as long as 139.09 holds on a closing basis; a failure there would reopen the gap toward the 50-SMA. The bullish structure is intact but the risk/reward tightens on chase entries into strength.
EntryPreferred accumulation zone 139.50–141.50 on a pullback toward the 200-SMA; momentum add-on trigger above 145.00 on a strong close.
InvalidationDaily close below 137.00 invalidates the reclaim thesis, signaling the 200-SMA has flipped back to resistance and opening downside toward the 50-SMA.
Targets150.00 as initial measured resistance and psychological level → 160.00–163.00 extension zone if momentum persists
TimeframeSwing (2-6 weeks)
Inflection70
Probability61
Quality87
ASAN is pinned exactly at its 200-day SMA (8.81) after reclaiming the 50-day (8.42), setting up a classic inflection where the prior downtrend proxy either flips to support or rejects price back into the range.
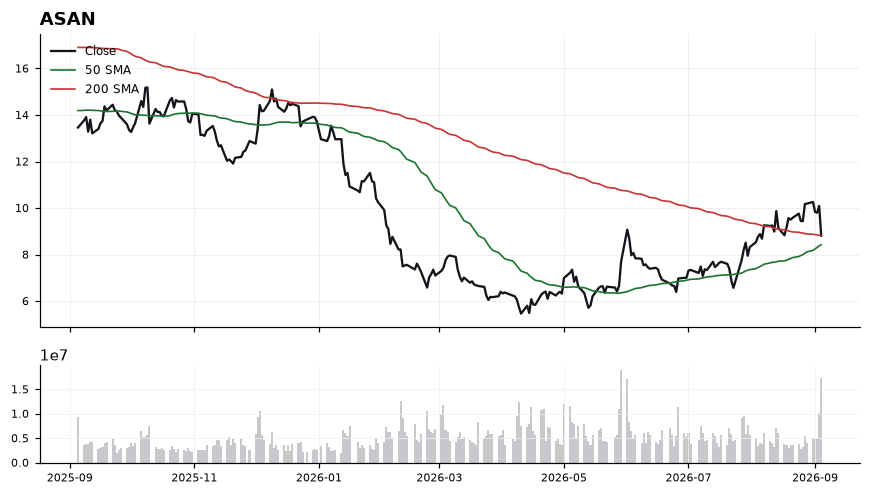
Price at 8.81 sits 0.0% versus the 200-SMA and roughly 4.6% above the rising 50-SMA at 8.42, indicating a constructive short-term structure meeting long-term resistance. RSI at 45.17 is mid-range and slightly soft, showing no momentum thrust to confirm a breakout yet. MACD at 0.36 has rolled beneath its signal at 0.46, a near-term negative cross that argues for patience before committing. Net read: trade-quality is high (86.6) and inflection is real (70.4), but momentum needs to catch up to price.
EntryWatch for a decisive reclaim and hold above 8.90 on a daily close as trigger; alternatively, a pullback into the 8.42-8.50 zone (50-SMA retest) offers a lower-risk entry.
InvalidationDaily close below 8.40 invalidates the setup — it would break the 50-SMA support and confirm rejection at the 200-day, reverting bias to neutral/negative.
Targets9.30 (first measured move above the 200-SMA shelf) → 9.85 (extension target on momentum confirmation)
TimeframeSwing (2-6 weeks)
Ranked by technical inflection, profit-probability, and trade quality. Educational only. Not financial advice.