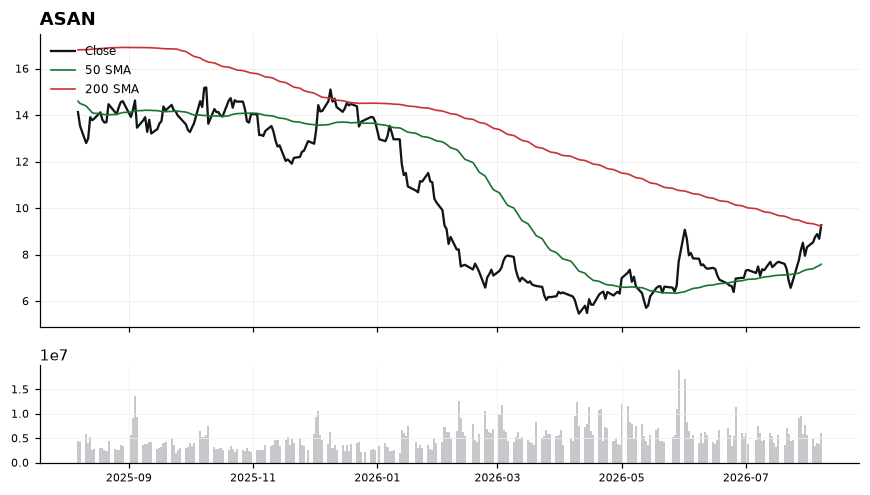
Price sits 22% above the rising 50-SMA (7.59) and fractionally above the 200-SMA (9.22), confirming a strong short-term uptrend now colliding with the dominant long-term mean. RSI at 67.2 is constructive but within a few points of overbought, indicating limited slack before mean-reversion risk rises. MACD's positive spread (0.44 vs 0.29) supports continuation, yet the 200-SMA has historically acted as resistance and needs to be defended on a closing basis to validate the breakout. Net read: momentum favors longs, but the 9.20–9.26 shelf is the pivot that must hold.
Sunday Playbook — Top 5 Setups
The day's five highest-conviction setups, ranked by technical inflection, profit-probability, and trade quality — 5 long, 0 short. Trade your plan and manage risk first. Also screened: $FSLR, $RKLB, $SPY, $ETOR, $COST, $QCOM.
ASAN is testing its 200-SMA at 9.22 from below with price at 9.26 (just 0.43% above), marking a classic long-term trend inflection where a confirmed reclaim could flip the multi-quarter regime. Momentum is aligned — MACD 0.44 over signal 0.29 and RSI 67.2 — but proximity to the 200-SMA and near-overbought readings argue for disciplined execution rather than chasing.
HD is trading at 355.62, above both the 50-SMA (334.58) and 200-SMA (348.14), with the 50-day now curling under price and the 200-day acting as the pivot just 2.15% below. The setup sits at an inflection because momentum has turned constructive while price is still within striking distance of the long-term mean, keeping the working long bias viable without chasing.

RSI at 61.29 is firmly bullish but not yet overbought, leaving room before the 70 threshold. MACD at 3.70 versus a 1.91 signal line confirms a positive momentum crossover with widening spread, consistent with trend continuation. The reclaim of the 200-SMA at 348.14 and the stack of price > 50-SMA > 200-SMA argue for a golden-cross posture, though the narrow 2.15% distance to the 200-day means any slip pulls the trade back to the decision line. Trade-quality (85.2) and profit-probability (83.0) reinforce the technical read even as inflection score (62.6) flags this as a developing, not fully extended, move.
NOW is trading at 124.88, holding just above the reclaimed 200-SMA (123.35, +1.24%) with the 50-SMA (107.32) trending sharply higher beneath — a classic post-recovery inflection where trend structure has flipped constructive but proximity to the long-term mean keeps the setup unresolved.

Price sits above both moving averages, and the 50-SMA at 107.32 is well below the 200-SMA at 123.35, indicating an emerging bullish alignment rather than a mature uptrend. MACD at 4.25 over signal 2.41 confirms positive momentum expansion, while RSI at 67.02 is firm but not yet stretched into the >70 exhaustion zone. The narrow 1.24% cushion over the 200-SMA is the key tell: it defines a tight risk line and frames the current tape as a breakout retest rather than a chase. Technical-inflection (69.9) and trade-quality (79.8) scores corroborate a setup that is actionable but sensitive to a failed reclaim.
AKAM is basing just 4.04% above its rising 200-SMA (106.25) while trapped below a declining 50-SMA (125.86), setting up a mean-reversion inflection as MACD (-2.05 vs signal -2.34) curls higher and RSI (40.36) lifts off oversold territory.

Price at 110.54 is holding the 200-SMA shelf near 106.25, which has become the line-in-the-sand support for the longer-term uptrend. The MACD histogram has flipped positive with the line above signal, marking the first momentum thaw after an extended downdraft, though RSI at 40 confirms buyers are not yet in control. The 50-SMA at 125.86 sits ~14% overhead as the primary resistance and gap-fill objective, meaning the reward asymmetry favors a tactical long only while the 200-SMA holds.
HIMS is coiling just above its rising 50-SMA (31.44) and well above the 200-SMA (29.73), setting up a low-volatility inflection where price (31.59) is pressing against short-term equilibrium with a fresh MACD crossover attempt (-0.56 vs -0.60).

The trend structure remains constructive: price holds 6.25% above the 200-SMA and marginally above the 50-SMA, confirming the higher-timeframe uptrend is intact. RSI at 51.02 is neutral, leaving directional room in either direction without overbought risk, while MACD, though still below zero, has curled above its signal line — an early momentum inflection rather than confirmed thrust. The tight cluster of price, 50-SMA and the round 31.00 handle defines a decision zone; sustained acceptance above 31.60 would tilt the tape toward trend continuation, whereas a slip back under 31.44 re-opens a test of the 200-SMA shelf.
Ranked by technical inflection, profit-probability, and trade quality. Educational only. Not financial advice.