Wednesday Playbook — Top 5 Setups

The day's five highest-conviction setups, ranked by technical inflection, profit-probability, and trade quality — 5 long, 0 short. Trade your plan and manage risk first. Also screened: $ALGN, $SPY, $IONQ, $COST, $DPZ, $QQQ.

1$CVNATradedLongMedium convictionscore 78
Inflection68
Probability83
Quality87

CVNA is pressing against its 200-day SMA (72.37) from below with price at 72.48, a classic inflection where a reclaim of the long-term trend line meets an already-rising 50-day (66.77). With trade-quality scored 86.5 and profit-probability 83.0, the setup favors a working long bias into the retest.
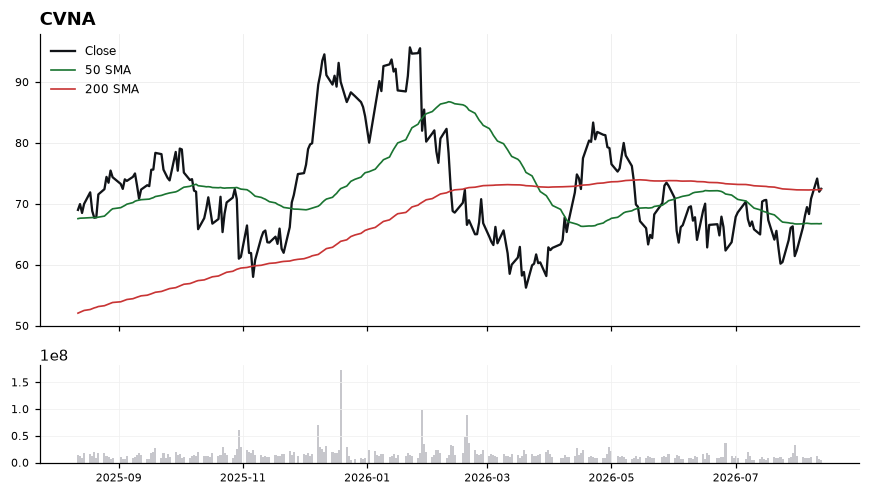
CVNA chart with 50 and 200 day moving averages

Price sits just 0.15% above the 200-SMA, confirming the retest is live rather than resolved. RSI at 58.87 is constructively trending but not yet overbought, leaving room to extend, while MACD at 1.42 over signal 0.39 shows a wide, positive spread consistent with fresh momentum. The 50-SMA at 66.77 provides a rising floor roughly 8% below spot, framing a stacked bullish structure provided 72.37 holds on a closing basis.

EntryAccumulation zone 71.50–72.50 on a hold of the 200-SMA (72.37), or breakout add-on above 73.80 to confirm reclaim.
InvalidationClosing break below 69.50 invalidates the 200-SMA reclaim thesis and shifts price back into the prior range between the 50- and 200-SMAs.
Targets76.80 — first extension off the 200-SMA reclaim → 82.00 — measured continuation as MACD spread carries
TimeframeSwing (2-6 weeks)
2$HIMSTradedLongMedium convictionscore 76
Inflection63
Probability83
Quality86

HIMS is coiling just above its 200-SMA at 29.47 while capped by the 50-SMA at 31.70, creating a compressed range that typically resolves with directional force. With MACD (-0.45) now curling above its signal (-0.52) and RSI at 47, the tape is quietly transitioning from downside momentum toward a potential mean-reversion attempt.

HIMS chart with 50 and 200 day moving averages

Price at 29.97 sits only 1.71% above the rising 200-SMA, a classic 'line-in-the-sand' zone that is defending buyers so far. The 50-SMA at 31.70 is sloping into the tape as immediate overhead resistance, and RSI at 47 confirms momentum is neutral rather than trending. A positive MACD histogram cross beneath the zero line is an early inflection tell, but until price reclaims the 50-SMA the structure remains a range-bound tug-of-war between 29.47 support and 31.70 resistance.

EntryConsider staged engagement in the 29.50–30.00 reclaim zone on a hold of the 200-SMA, with an add-on trigger on a confirmed close above 30.75 that signals momentum shift toward the 50-SMA.
InvalidationInvalidation on a decisive close below 28.90 (roughly 2% under the 200-SMA); breaking that level flips the multi-month trend proxy and negates the long-side inflection thesis.
TargetsFirst target 31.70 at the 50-SMA, the primary overhead resistance → Second target 33.25, extending ~5% above the 50-SMA on a confirmed trend reclaim
TimeframeSwing (2-6 weeks)
3$NOWHotLongMedium convictionscore 75
Inflection66
Probability83
Quality79

NOW is trading at 124.94, holding above both the rising 50-SMA (107.54) and the reclaimed 200-SMA (122.43), placing price at an inflection where the long-term trend is attempting to flip constructive.

NOW chart with 50 and 200 day moving averages

Price sits just 2.05% above the 200-SMA, a tight cushion that makes this level the key pivot for the bias. Momentum confirms the tape: RSI(14) at 64.81 is firmly bullish without yet being overbought, and MACD at 5.77 remains above its signal at 3.93, indicating expanding upside momentum. The 50-SMA at 107.54 is well below spot, evidencing a strong intermediate uptrend, though the 2% gap to the 200-SMA leaves little margin for error on any pullback.

EntryPreferred accumulation on a pullback into 122.43–123.50 (200-SMA retest); alternatively, momentum add on a decisive close above 126.00 with RSI holding >60.
InvalidationDaily close below 121.00 (roughly 1.2% under the 200-SMA); losing this level negates the trend-reclaim thesis and reopens downside toward the 50-SMA zone.
TargetsFirst target 132.00 (measured extension from the 200-SMA reclaim) → Second target 138.50 (prior structural resistance / momentum objective)
TimeframeSwing (2-6 weeks)
4$GOOGLMAG7LongMedium convictionscore 74
Inflection56
Probability83
Quality91

GOOGL is consolidating between its rising 200-SMA (330.56) and declining 50-SMA (354.47) at 343.54, sitting at an inflection where a bullish MACD crossover meets sub-50 RSI — a classic pullback-in-uptrend setup within the MAG7 complex.

GOOGL chart with 50 and 200 day moving averages

Price trades 3.93% above the 200-SMA (330.56), preserving the longer-term uptrend, but remains 3.1% below the 50-SMA (354.47), which now acts as immediate overhead supply. RSI at 45.74 is neutral-to-soft, leaving room to run before overbought conditions, while MACD at -0.48 above its signal at -0.95 signals waning downside momentum and a nascent turn. The technical-inflection score of 56.3 alongside a trade-quality read of 91.0 argues the risk/reward geometry is favorable if the 200-SMA holds as dynamic support.

EntryStagger entries: initial tranche 340–344 on stabilization, add on a reclaim of the 50-SMA at 354.47 with MACD crossing zero
InvalidationDaily close below 329.50 (under the 200-SMA at 330.56) — would break the longer-term trend structure and invalidate the pullback-buy thesis
TargetsFirst target 354.50 at the 50-SMA — expect initial supply and partial profit-taking → Second target 368.00, projecting a measured move above the 50-SMA on trend continuation
TimeframeSwing (2-6 weeks)
5$RKLBTradedLongMedium convictionscore 73
Inflection57
Probability83
Quality84

RKLB is coiling between its rising 200-SMA (78.24) and declining 50-SMA (87.09), sitting just 3.75% above long-term trend support. With MACD (-1.45) crossing back above its signal (-4.37) and RSI recovering to 54.3, the tape is inflecting from oversold repair toward a potential trend resumption.

RKLB chart with 50 and 200 day moving averages

Price at 81.17 has reclaimed the 200-SMA (78.24) but remains capped by the 50-SMA (87.09), defining a clear 78–87 battle zone. The MACD histogram turning positive while still below zero signals momentum improvement without confirmation of a full trend flip. RSI at 54.3 is constructive — above the 50 midline but with headroom before overbought — consistent with early-stage recovery. Trade-quality (84.1) and profit-probability (83.0) scores are strong, though inflection (57.0) suggests confirmation is still pending.

EntryStaged accumulation on strength through 82.50, or on a controlled pullback into the 79.00–79.50 shelf just above the 200-SMA
InvalidationDaily close below 77.50 invalidates the thesis — it would break the 200-SMA support and negate the MACD recovery, flipping trend structure lower
TargetsFirst target 87.00 at the 50-SMA — the immediate supply zone → Second target 92.00–93.00 on a confirmed 50-SMA breakout
TimeframeSwing (2-6 weeks)

Ranked by technical inflection, profit-probability, and trade quality. Educational only. Not financial advice.