Price sits 3.98% above the 200-SMA and roughly 7.8% above the 50-SMA, evidence of trend strength but also stretch risk. MACD at 14.02 versus signal 4.14 shows a wide positive spread, confirming upside momentum acceleration. RSI at 67.18 is bullish yet nearing the 70 threshold, suggesting a pullback into the 623–635 shelf would offer a higher-quality long entry. The 50-SMA at 600.90 defines the deeper trend floor; loss of it would invalidate the bullish structure.
Monday Playbook — Top 5 Setups
The day's five highest-conviction setups, ranked by technical inflection, profit-probability, and trade quality — 5 long, 0 short. Trade your plan and manage risk first. Also screened: $IBIT, $CVNA, $AAOI, $SPY, $AMZN, $SHOP.
Inflection60
Probability78
Quality91
META trades at 648.03, extended above both the rising 50-SMA (600.90) and 200-SMA (623.23) with the 50 crossing back above the 200, marking a bullish structural inflection. Momentum is confirming, but with RSI at 67.18 the tape is approaching overbought and warrants disciplined entry.
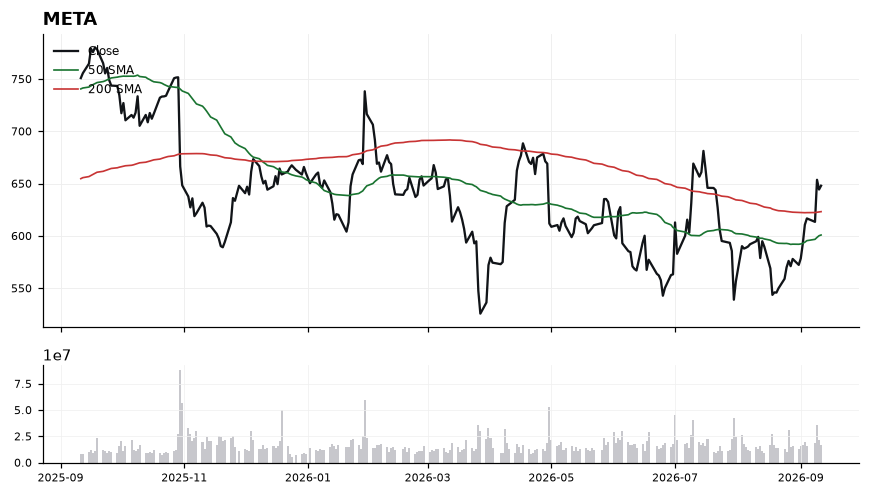
EntryPreferred accumulation zone 630–638 on a pullback; alternatively, breakout continuation entry above 652 with confirmation. Avoid chasing above 655 without a reset in RSI.
InvalidationDaily close below 615 invalidates the setup — it would break the recent higher-low structure and put price back below the 200-SMA (623.23), signaling failure of the bullish inflection.
Targets672 — measured extension from the 50/200-SMA base → 695 — trend continuation objective if momentum persists
TimeframeSwing (2-6 weeks)
Inflection75
Probability64
Quality86
TXRH is testing its rising 200-SMA (180.01) with price at 181.22, just 0.67% above this multi-quarter trend line. RSI at 28.58 signals oversold conditions right at a critical technical inflection, creating a potential mean-reversion setup within the working long bias.
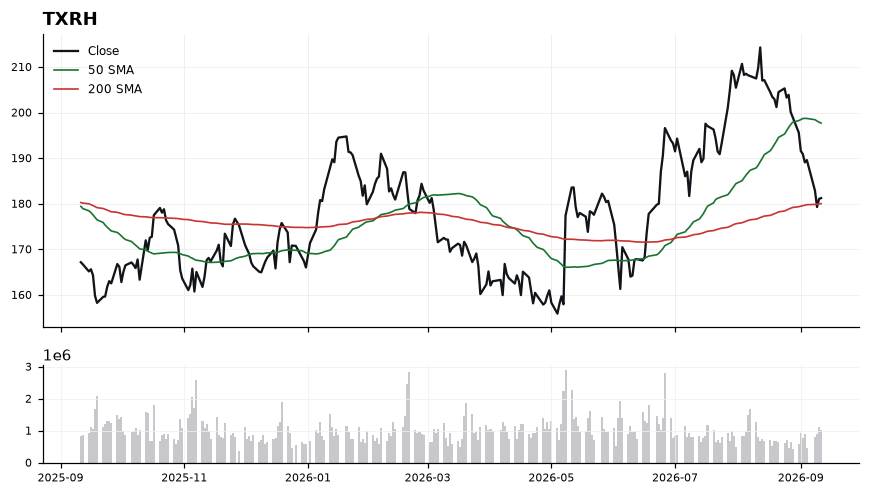
Price has decoupled sharply from the 50-SMA at 197.68, sitting roughly 8.3% below it, which explains the oversold RSI reading of 28.58 and the negative MACD spread (-5.22 vs signal -2.83) showing momentum still leaning down. However, the 200-SMA at 180.01 is acting as the line-in-the-sand: holding it preserves the longer-term uptrend structure, while the oversold RSI increases the probability of a reflex bounce. The MACD histogram remains negative, so confirmation of a momentum turn is not yet in hand — this is an inflection zone, not a confirmed reversal.
EntryStage entries in the 180.00–182.50 zone on stabilization near the 200-SMA; add on reclaim/close above 185 to confirm the oversold bounce is engaging.
InvalidationDaily close below 177.50 invalidates the setup — it would breach the 200-SMA decisively and open risk of a trend-change leg lower.
TargetsFirst target 190.00 (gap toward the 50-SMA) → Second target 197.50 (retest of the 50-SMA at 197.68)
TimeframeSwing (2-6 weeks)
Inflection69
Probability69
Quality86
ASAN is coiling right at its 200-day SMA (8.74) with price at 8.77, sitting just above a rising 50-SMA (8.54) — a classic long-bias inflection where the intermediate trend is being retested.
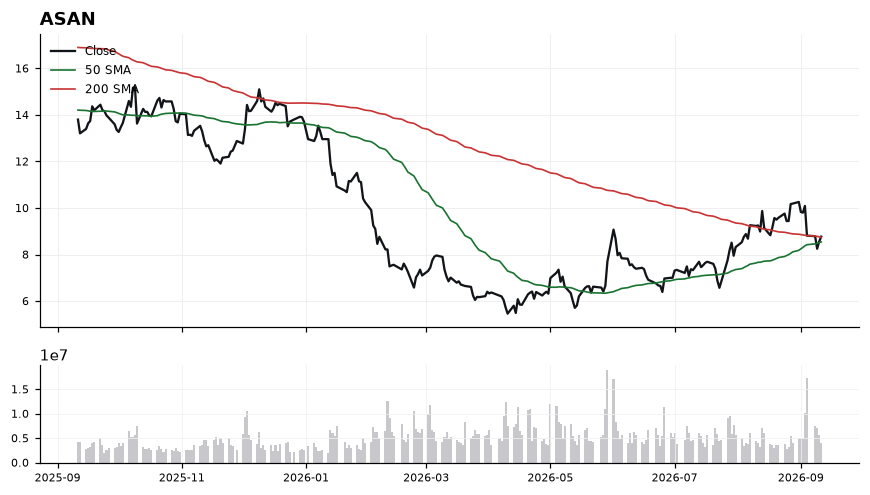
Price is only 0.29% above the 200-SMA, framing 8.74 as the pivot that separates a reclaim from a rejection. RSI at 46.4 is neutral-to-soft, and MACD (0.04) has crossed below its signal (0.25), signaling near-term momentum has faded even as the 50-SMA remains constructively below price. The tight cluster between 8.54 (50-SMA) and 8.77 (spot) creates a narrow decision zone; a hold above 8.74 keeps the working long bias intact, while loss of 8.54 would break structure.
EntryConsider engagement on a reclaim/hold of 8.74–8.80 with confirmation, or a pullback into 8.55–8.60 near the 50-SMA
InvalidationBelow 8.45 (closing basis); breaking this level voids the 50-SMA support and negates the long inflection thesis
TargetsFirst target 9.10 (recovery of prior momentum shelf) → Second target 9.45 (extension above 200-SMA cluster)
TimeframeSwing (2-6 weeks)
Inflection63
Probability69
Quality93
GOOGL is coiling just above its rising 200-SMA (336.81) at 338.50, sitting only 0.50% above long-term trend support while trading below its 50-SMA (347.18) — a classic pullback-to-trend inflection where the working long bias must be defended or invalidated.
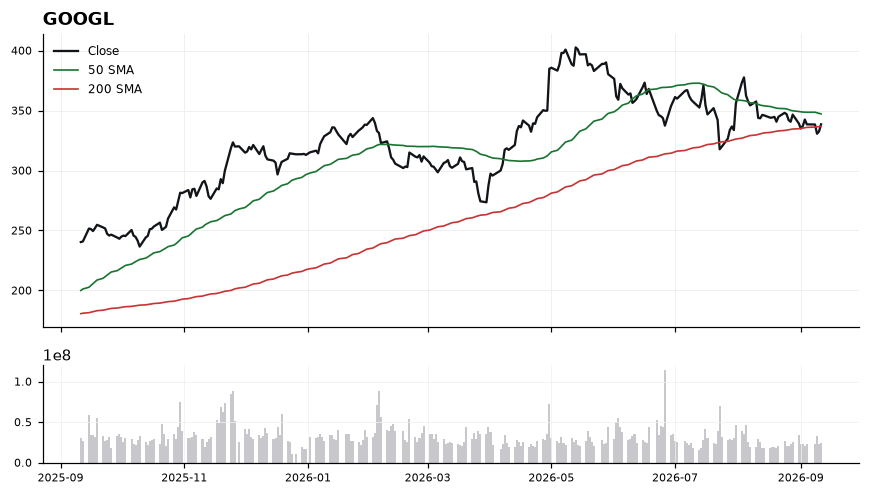
Price is pinned between the 200-SMA floor at 336.81 and the 50-SMA ceiling at 347.18, framing a tight ~3% decision box. RSI at 46.79 is neutral-soft, showing no oversold washout but also no momentum thrust, while MACD at -3.61 below its signal line at -3.18 confirms short-term momentum is still deteriorating. The trade-quality score of 93.3 and profit-probability of 69.0 argue the structure is high grade, but the sub-signal MACD warns that entries need to be staged rather than chased.
EntryStage longs into the 337.00-339.00 zone on a hold of the 200-SMA (336.81); add on a reclaim of the 50-SMA with a close above 347.50 confirming momentum flip.
InvalidationDaily close below 333.00 (roughly 1.1% under the 200-SMA) invalidates the trend-support thesis and signals a broader breakdown of the long setup.
Targets347.18 — reversion to the 50-SMA and top of the current compression box → 358.00 — measured continuation above the 50-SMA reclaim, ~6% above spot
TimeframeSwing (2-6 weeks)
Inflection45
Probability93
Quality80
QCOM is trending higher within the Semiconductors complex, printing 181.97 while riding well above a tightly clustered 50-SMA (168.60) and 200-SMA (168.10). The inflection sits in the tension between strong trend/momentum (MACD 2.56 vs signal 0.27) and an RSI of 66.29 approaching overbought, suggesting the tape is extended but not yet exhausted.
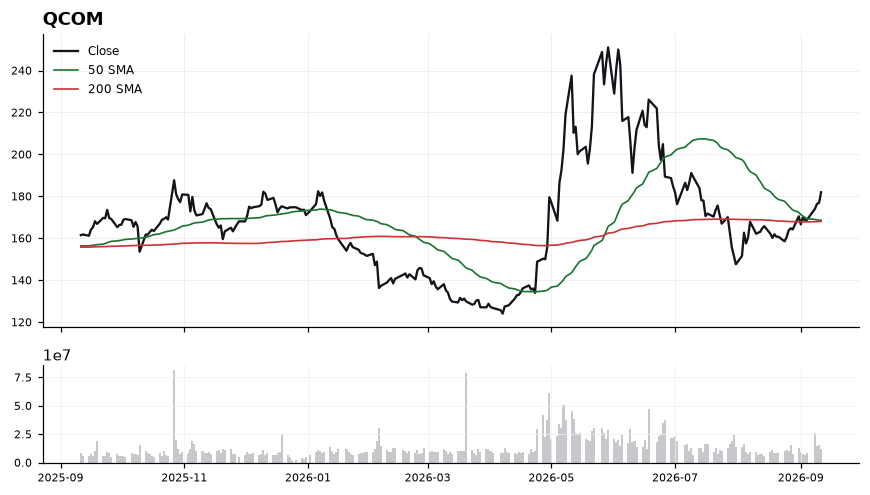
Price is 8.25% above the 200-SMA, confirming a mature uptrend, while the near-flat 50/200-SMA stack (168.60 / 168.10) marks a well-defined structural support shelf ~7-8% below spot. MACD at 2.56 versus a signal of 0.27 shows a wide, positive spread — momentum is firmly with the bulls but the histogram gap invites mean-reversion risk. RSI at 66.29 is bullish-regime but within striking distance of the 70 threshold, so chasing strength carries poor reward-to-risk. The preferred read is to let price pull back toward the rising 50-SMA rather than extend into stretched levels.
EntryPreferred accumulation zone 172.00-175.00 on a controlled pullback toward the 50-SMA (168.60); alternative momentum trigger on a daily close above 184.00 with RSI holding under 72.
InvalidationDaily close below 167.50 — this breaks both the 50-SMA (168.60) and 200-SMA (168.10) cluster, invalidating the trend structure and flipping bias to neutral/defensive.
Targets188.50 — measured extension from the current MACD impulse and prior swing resistance → 196.00 — next projected leg, roughly 16% above the 200-SMA where trend exhaustion typically emerges
TimeframeSwing (2-6 weeks)
Ranked by technical inflection, profit-probability, and trade quality. Educational only. Not financial advice.