Momentum favors the long bias — RSI(14) at 66.96 is strong but not yet stretched into classic overbought territory, and MACD at 7.63 remains above its 5.01 signal, indicating trend momentum is still expanding. The 50-SMA sits ~8.5% below price, evidencing a well-established medium-term uptrend, while the freshly reclaimed 200-SMA at 412.95 now converts into first-line support. The key tell is whether 412.95 holds on any pullback; a decisive hold would validate the breakout, while repeated closes back below would signal a failed reclaim.
Wednesday Playbook — Top 5 Setups
The day's five highest-conviction setups, ranked by technical inflection, profit-probability, and trade quality — 5 long, 0 short. Trade your plan and manage risk first. Also screened: $AKAM, $HD, $ASAN, $NOW, $SPY, $AVGO.
Inflection74
Probability78
Quality87
GLD is extending a strong uptrend, printing 413.84 just above the reclaimed 200-SMA (412.95) with the 50-SMA (381.56) sloping higher underneath. The tape sits at an inflection: price is only 0.21% above the 200-day, so this session either confirms the breakout or fades back into range.
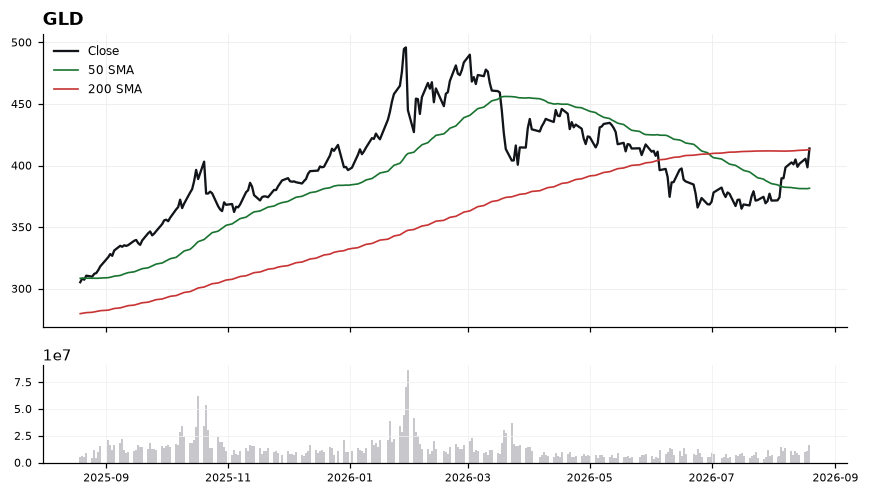
EntryPreferred entry on a confirmed hold of the 200-SMA: 413.00-414.50 on strength, or a pullback tag of 412.95-410.00 that reclaims intraday. Avoid chasing beyond 416.
InvalidationDaily close below 408.00 invalidates the reclaim thesis — it would signal the 200-SMA break was a fakeout and momentum has rolled over back toward the 50-SMA zone.
Targets422.00 — measured extension from the 200-SMA reclaim → 432.00-435.00 — trend continuation objective as MACD momentum persists
TimeframeSwing (2-6 weeks)
Inflection63
Probability83
Quality86
CAVA is coiling right at its 200-day SMA (71.00) and just below its 50-day SMA (72.47), a compression zone where the working long bias hinges on reclaiming trend. With MACD (0.04) crossing above signal (-1.26) and RSI at 55.23, momentum is inflecting upward without being extended.
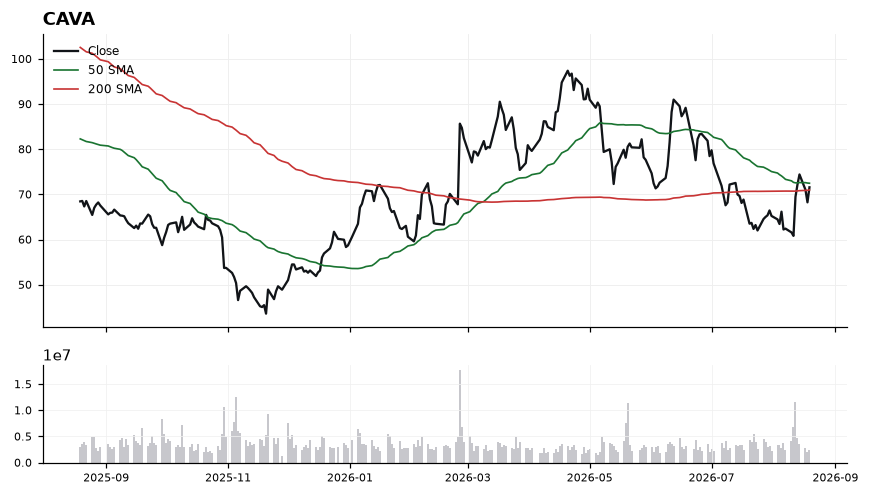
Price at 71.57 sits only 0.81% above the 200-SMA, making that line the pivotal defense level for bulls. The 50-SMA at 72.47 caps the tape overhead and is the immediate hurdle that separates a chop-range from a trend resumption. MACD's bullish cross from deeply negative territory (-1.26 signal) signals a momentum thrust building, while RSI at 55.23 confirms improving strength with room before overbought. Trade-quality (86.1) and profit-probability (83.0) scores reinforce a constructive but not yet confirmed setup.
EntryStage entries on either a pullback into 71.00-71.30 (200-SMA retest) or a confirmed reclaim of the 50-SMA at 72.47 on rising momentum.
InvalidationBelow 69.75 (roughly 1.75% under the 200-SMA); breaking this negates the reclaim thesis and flips price back below trend, invalidating the long bias.
TargetsFirst target 74.50, clearing the 50-SMA and prior micro-resistance → Second target 77.25, extending ~8% above the 200-SMA into measured-move territory
TimeframeSwing (2-6 weeks)
Inflection61
Probability83
Quality85
VRT sits at 261.00, wedged between reclaimed 200-SMA support (252.46) and a downtrending 50-SMA overhead (294.77) — a classic mean-reversion inflection where the AI infrastructure long thesis is being retested at trend support.
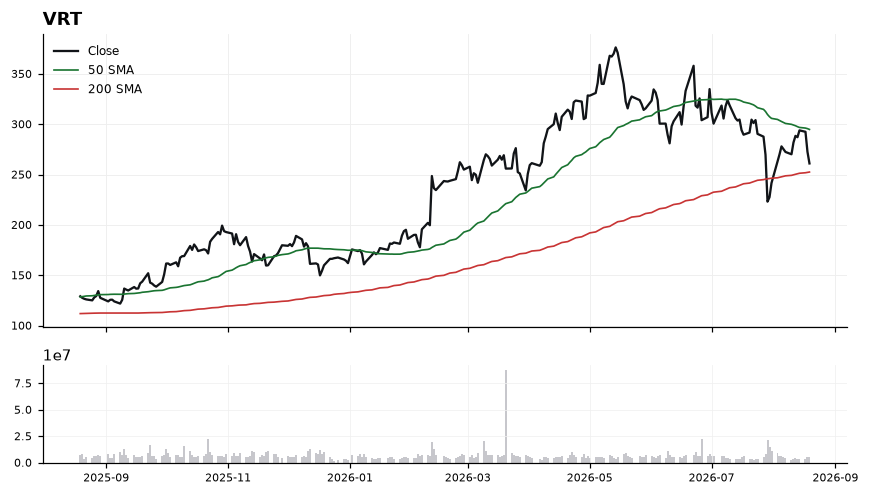
Price is just 3.38% above the rising 200-SMA, providing a defined risk shelf, while the 50-SMA at 294.77 caps upside and confirms the intermediate pullback. RSI at 41.47 is subdued but not oversold, leaving room for upside without divergence risk, and MACD at -4.51 crossing above its signal at -6.20 marks an early momentum inflection off the lows. The setup favors accumulation near the 200-SMA rather than chasing, with trade-quality (85.4) and profit-probability (83.0) reinforcing an asymmetric long skew.
EntryScale-in zone 255.00–262.00 (current tape), with a confirmation add on a reclaim of 268.00 that would validate the MACD cross.
InvalidationDaily close below 248.00 invalidates the setup — it would break the 200-SMA (252.46) and negate the long-term uptrend structure.
TargetsFirst target 282.00 (mid-gap fill toward the 50-SMA) → Second target 294.00 (tag of the 50-SMA at 294.77)
TimeframeSwing (2-6 weeks)
Inflection64
Probability83
Quality79
CRM is a Hot long-bias setup with price at 206.09 pushing through the 200-SMA (201.36) — a classic trend-recovery inflection where the tape is transitioning from base-building above the 50-SMA (173.23) to reclaiming the long-term average.
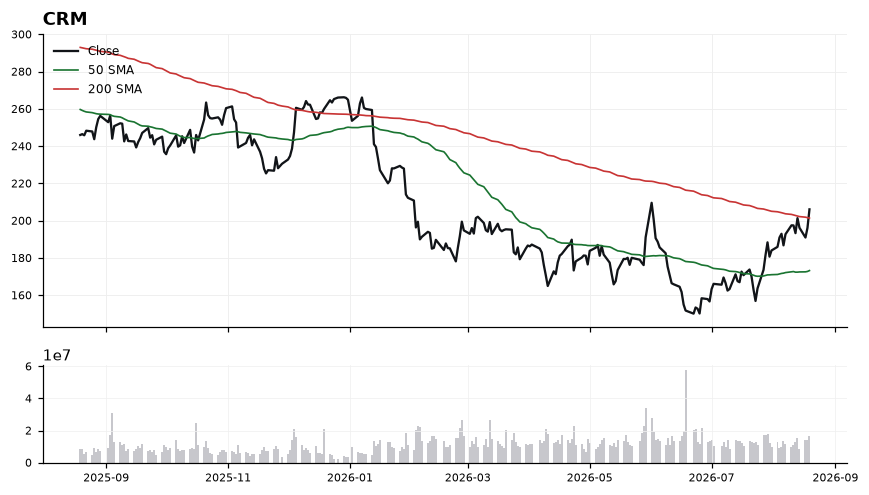
Price sits 2.35% above the 200-SMA and comfortably above the 50-SMA, confirming the 50 remains a rising demand zone while the 200 flips from resistance to first support. RSI at 64.76 is firmly bullish but not yet stretched, leaving room before the 70 overbought threshold. MACD at 7.53 over signal 6.80 confirms positive momentum with an intact bullish cross, though the narrow spread suggests momentum needs follow-through to accelerate. Net read: constructive trend-inflection, but the reclaim of the 200-SMA must hold to validate the higher timeframe shift.
EntryPreferred entry on a pullback into 201.50–203.50 (retest of the 200-SMA at 201.36), or momentum trigger on a decisive close above 208.00.
InvalidationInvalidation on a daily close below 198.00; that would put price back beneath the 200-SMA, negate the reclaim, and signal the inflection has failed.
TargetsFirst target 215.00 — measured extension from the 200-SMA reclaim and prior supply cluster → Second target 224.00 — trend continuation objective if RSI momentum expands without breaching 75
TimeframeSwing (2-6 weeks)
Inflection56
Probability84
Quality84
RH is coiled just above its 50-SMA (168.46) and 200-SMA (163.35), with the 50 now stacked above the 200 — a constructive backdrop, but momentum has softened, putting price at a decision point between reclaiming trend or losing the moving-average shelf.
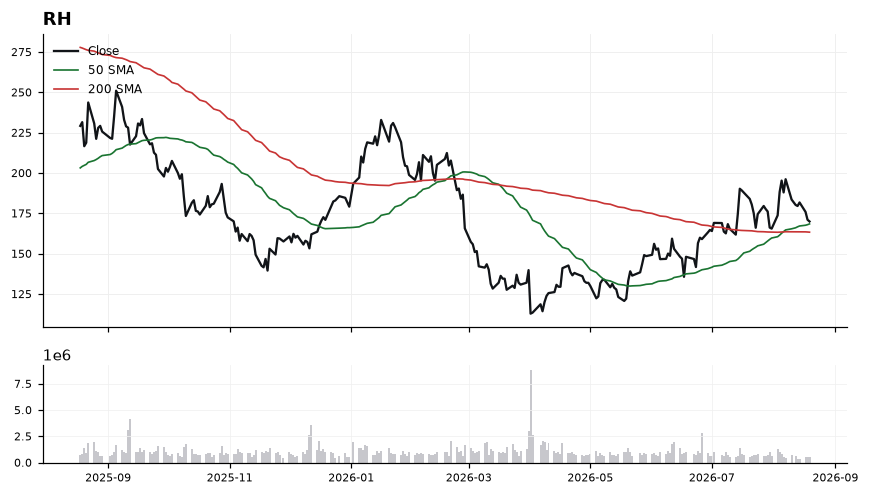
Spot 169.97 sits only 1.5 points above the 50-SMA and roughly 4.06% above the 200-SMA, keeping the long-term structure intact. RSI(14) at 45.73 is neutral-to-soft, showing no momentum thrust yet, while MACD at 1.83 has crossed below its signal at 4.09, flagging near-term deceleration. The setup is a pullback within a rising MA structure rather than a breakout — inflection score 55.9 reflects that tension between healthy trend and cooling momentum.
EntryPrefer staged accumulation on strength: initial tranche on a reclaim and hold above 171.50, add on a confirmed close back over 175 that would suggest MACD is curling back toward its signal. Avoid chasing; a dip-buy tranche can be considered near the 50-SMA at 168.50 only if it holds intraday.
InvalidationInvalidation on a daily close below 163.00, which would break the 200-SMA (163.35) and negate the long-term uptrend thesis, shifting bias to neutral/short.
TargetsFirst target 178.50, where prior momentum stalled and where MACD would need to re-cross its signal → Second target 185.00, a measured extension that requires RSI to push back above 60
TimeframeSwing (2-6 weeks)
Ranked by technical inflection, profit-probability, and trade quality. Educational only. Not financial advice.