Price at 110.75 sits in no-man's land: reclaiming momentum requires clearing the 50-SMA at 115.76, while the 200-SMA at 109.79 is the line in the sand. RSI at 48.62 is neutral but drifting toward equilibrium, signaling indecision rather than exhaustion. MACD at -3.04 has crossed above its signal at -3.17, an early bullish crossover suggesting downside momentum is fading. Trade-quality (86) and profit-probability (83) scores support a constructive tactical bias, contingent on the 200-SMA holding.
Thursday Playbook — Top 5 Setups
The day's five highest-conviction setups, ranked by technical inflection, profit-probability, and trade quality — 5 long, 0 short. Trade your plan and manage risk first. Also screened: $TXRH, $CRWV, $IBIT, $AFRM, $AVGO, $GOOGL.
Inflection65
Probability83
Quality86
AKAM is coiling just above its 200-SMA (109.79) and 0.87% above that key line, while trading below the 50-SMA at 115.76 — a classic inflection where bulls must defend the long-term trend or cede control.
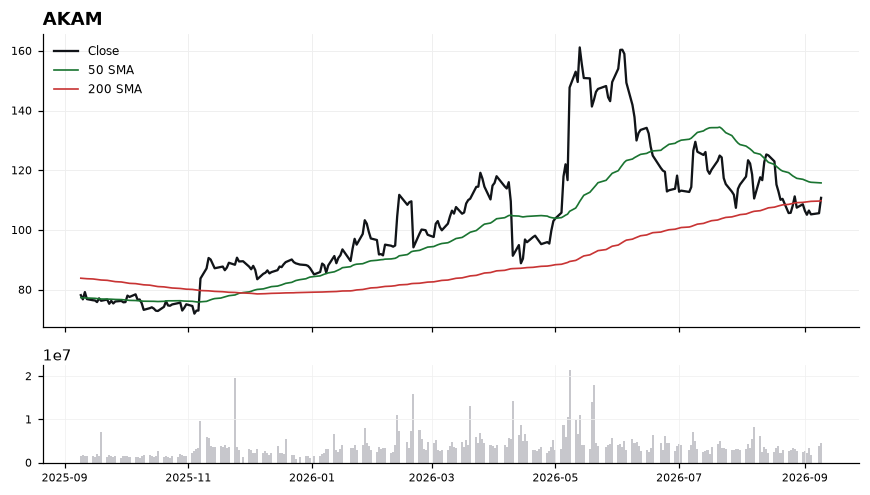
EntryStagger entries on strength: initial tranche 110.75-111.25 on a hold of the 200-SMA, add on a reclaim above 113.00 confirming momentum shift.
InvalidationDaily close below 108.50 (roughly 1.2% under the 200-SMA); breaking this invalidates the long-term uptrend structure and negates the MACD crossover thesis.
TargetsFirst target: 115.76 (50-SMA) — the pivotal resistance that must be reclaimed to unlock trend continuation → Second target: 119.50-120.00, a measured move above the 50-SMA where prior supply likely re-emerges
TimeframeSwing (2-6 weeks)
Inflection64
Probability83
Quality87
VRT is coiling just above its rising 200-SMA (258.49) with the working long bias framed by an AI-infrastructure tape, and price at 262.89 sits at a decision point where a reclaim of the 50-SMA would flip the intermediate trend back up.
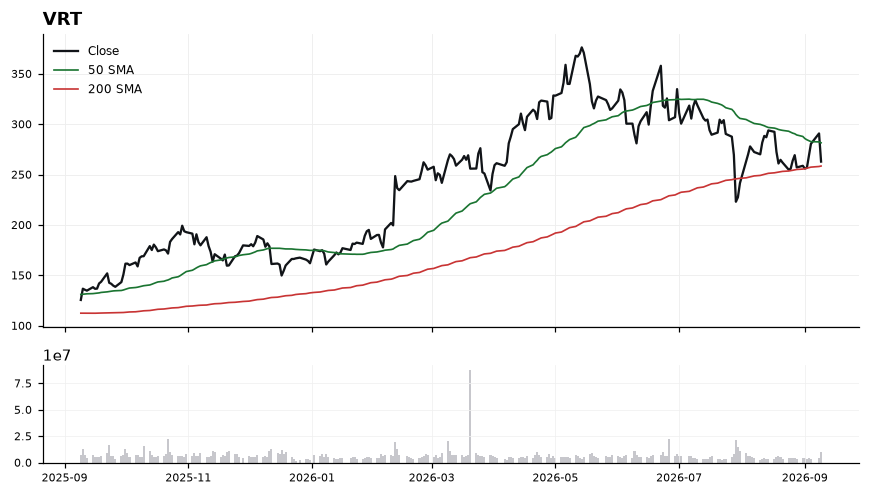
Price trades 1.70% above the 200-SMA (258.49) but 6.6% below the 50-SMA (281.55), signaling a pullback within a longer uptrend rather than a break. RSI at 46.31 is neutral and has room to expand upward before any overbought constraint. MACD at -2.53 is above its signal at -4.91, a bullish crossover geometry that suggests downside momentum is fading. The 63.7 inflection score and 86.5 trade-quality score reinforce that the risk/reward is stacking up near the 200-SMA shelf.
EntryAccumulate on strength into 263-266 with confirmation trigger on a reclaim and hourly close back above 268; alternative tactical add on a controlled retest of 259-261 that holds the 200-SMA.
InvalidationDaily close below 255 invalidates the setup — it would break the 200-SMA (258.49) and negate the MACD improvement, flipping structure to lower-highs.
Targets281 — mean-reversion to the 50-SMA (281.55) where sellers previously reasserted → 295 — extension target on a 50-SMA reclaim that reopens the prior swing zone
TimeframeSwing (2-6 weeks)
Inflection52
Probability98
Quality82
QCOM trades at 176.40, extended 5.05% above the 200-SMA (167.92) and 4.5% above the 50-SMA (168.76), with a bullish MACD cross (1.17 vs -0.82) confirming momentum while RSI at 61 signals strength without yet reaching overbought — a constructive but slightly stretched long setup.
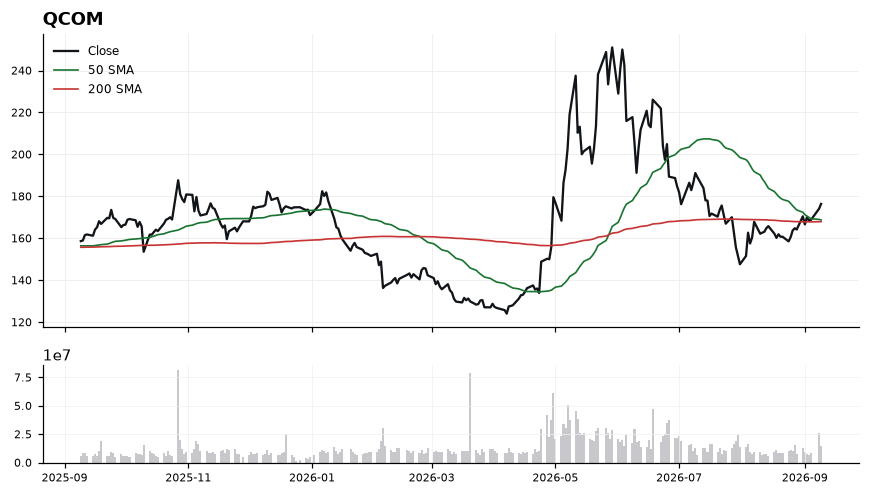
Price is riding above both moving averages, which are themselves converging near 168, forming a well-defined support shelf. MACD has separated meaningfully from its signal line, indicating momentum acceleration rather than exhaustion, and RSI at 61.16 leaves headroom before the 70 threshold. The 5.05% distance to the 200-SMA suggests a pullback toward the 50-SMA (168.76) would be a healthier re-entry than chasing the current print.
EntryPreferred entry on a pullback into the 170.00–172.50 zone (near-term prior resistance turned support); secondary trigger on a decisive close above 178.00 confirming continuation.
InvalidationDaily close below 167.50, which would break both the 50-SMA (168.76) and 200-SMA (167.92) confluence, invalidating the trend structure and flipping the momentum read.
TargetsFirst target 182.00, extending the current impulse from the MACD cross → Second target 188.50, a measured move consistent with the 50/200-SMA base breakout
TimeframeSwing (2-6 weeks)
Inflection59
Probability78
Quality90
META trades at 653.69, extended 4.98% above the rising 200-SMA (622.69) and 9.2% above the 50-SMA (598.58), with a bullish 50/200 alignment. The inflection is the tension between a decisive MACD bullish cross (8.71 vs -0.81) and an RSI at 70.43 flagging near-term overbought conditions.
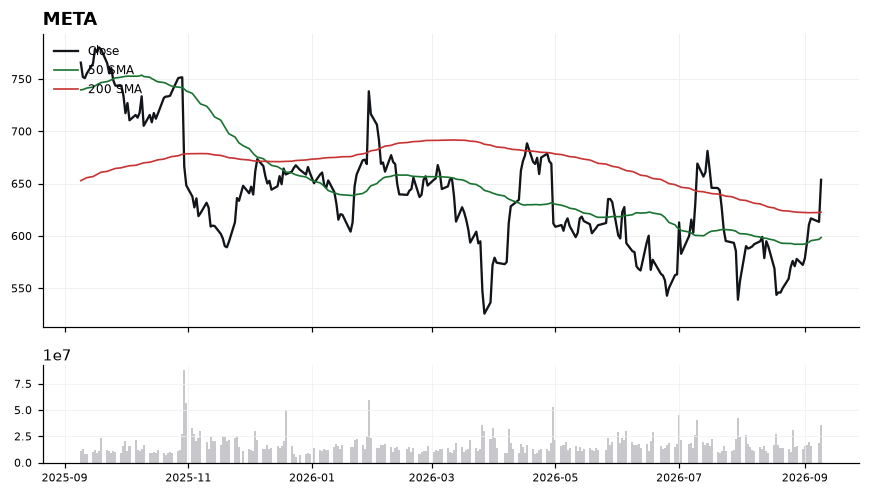
Trend structure is constructive: price sits above both moving averages and the 50-SMA has crossed back above the 200-SMA, validating the long bias. MACD at 8.71 versus signal -0.81 confirms momentum expansion, but RSI 70.43 warns that a pullback or consolidation can occur before continuation. The 200-SMA at 622.69 and the 50-SMA at 598.58 act as tiered structural supports, while the current price is now the immediate reference for breakout continuation. With trade-quality scored 90.3 and profit-probability 78.0 against a more modest inflection score of 59.3, the setup favors patience over chase.
EntryPreferred pullback entry into 635-625 (near prior breakout shelf and just above the 200-SMA at 622.69); alternative momentum add on a daily close above 660.
InvalidationDaily close below 615, which would breach the 200-SMA (622.69) and invalidate the trend-continuation thesis, opening downside toward the 50-SMA at 598.58.
TargetsFirst target 680 (measured extension from the 50/200-SMA base) → Second target 705 (trend continuation objective if momentum holds)
TimeframeSwing (2-6 weeks)
Inflection68
Probability69
Quality86
CVNA is coiling right at its 200-SMA (73.12) with price at 73.41, sitting just 0.40% above long-term trend — a classic inflection where the tape decides whether the reclaim holds or fails.
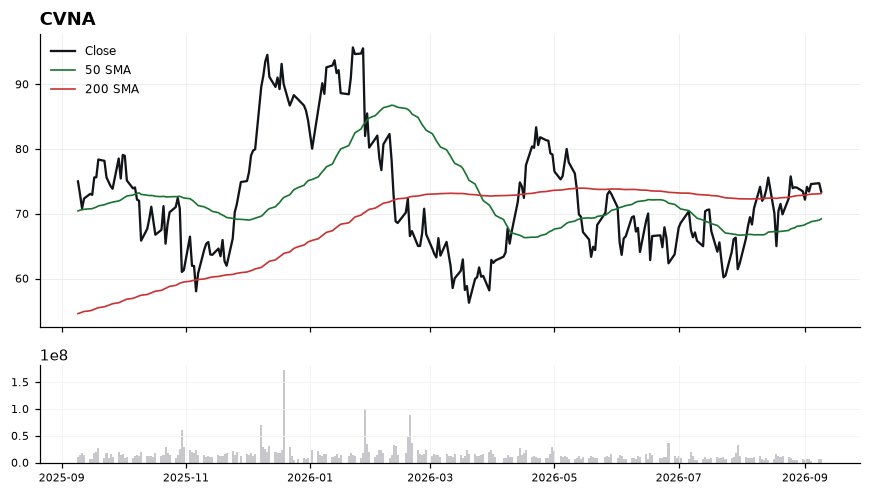
Price is constructively above the rising 50-SMA (69.21) and marginally above the 200-SMA (73.12), framing a bullish structural setup. RSI at 53.57 is neutral-positive with room to run before overbought, but MACD at 1.44 has just crossed below its signal (1.51), signaling near-term momentum cooling. The trade-quality score of 86.3 and inflection score of 68.2 support a constructive bias, but confirmation above the 200-SMA is required to validate the reclaim.
EntryTactical entry on strength above 73.75, or on a controlled pullback into the 71.50-72.00 zone that holds the 200-SMA as support.
InvalidationDaily close below 69.00, which would break the 50-SMA and invalidate the reclaim thesis, signaling a return to the prior range.
TargetsFirst target 78.50 (recent swing resistance and momentum extension) → Second target 83.00 (measured move from the 50/200-SMA compression)
TimeframeSwing (2-6 weeks)
Ranked by technical inflection, profit-probability, and trade quality. Educational only. Not financial advice.