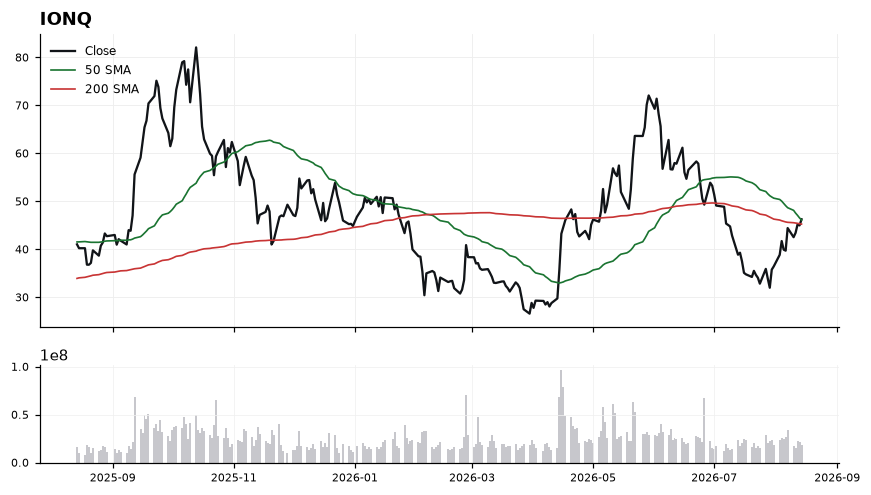
Price at 46.26 is only 2.23% above the 200-SMA, meaning the long-term trend line is still in play as the pivot of record. The 50-SMA sitting just 0.85 points above the 200-SMA hints at a nascent golden-cross alignment, and MACD's expansion above signal confirms buyers regaining short-term control. RSI at 59.28 is constructive but not stretched, supporting continuation if 46.10 holds on any pullback. The tight clustering of price and both SMAs, however, means the setup remains binary — a decisive break either way likely dictates the next multi-week leg.
Sunday Playbook — Top 5 Setups
The day's five highest-conviction setups, ranked by technical inflection, profit-probability, and trade quality — 5 long, 0 short. Trade your plan and manage risk first. Also screened: $RKLB, $NOW, $AVGO, $CVNA, $ALGN, $SPY.
IONQ is coiled at an inflection just above both its 50-SMA (46.10) and 200-SMA (45.25), with a MACD cross into positive territory (0.36 vs -1.24) signaling momentum has shifted while RSI at 59.3 leaves room before overbought conditions.

CAVA is grinding higher above both key moving averages, with price at 74.42 stacked over the 50-SMA (72.62) and 200-SMA (70.82) in a bullish alignment. The inflection: MACD at -0.72 has crossed decisively above its signal at -2.30, suggesting momentum is turning up from a reset while RSI at 61.69 confirms strength without being overbought.

Trend structure is constructive — price sits 5.08% above the 200-SMA and roughly 2.5% above the 50-SMA, making the rising 50-SMA (72.62) the first line of defense and the 200-SMA (70.82) the deeper trend pivot. RSI at 61.69 leaves headroom before the 70 overbought threshold, and the MACD gap of ~1.58 above signal points to improving momentum breadth. However, MACD remains sub-zero in absolute terms, so the recovery is early-stage rather than confirmed. Any close back below 72.62 would neutralize the near-term bullish read.
RDDT is coiled right at its 200-day SMA (177.86) with price at 178.09, having reclaimed the 50-day (175.02) — a classic inflection where a long base meets the long-term trend line.

Price sits just 0.13% above the 200-SMA and roughly 1.8% above the rising 50-SMA, signaling a constructive short-term structure attempting to flip the long-term trend. RSI at 55.3 is above midline but not overbought, leaving room for continuation, while MACD at -4.68 vs signal -5.44 shows a bullish crossover forming from below zero — momentum inflecting up. The tight cluster of price, 50-SMA and 200-SMA compresses volatility and typically resolves with an expansion move; direction is not yet confirmed until 200-SMA holds on a closing basis.
ASAN is reclaiming its 200-day SMA (9.09) with price at 9.14, testing a longer-term trend inflection while the 50-day (7.71) rises beneath, framing a classic base-to-breakout setup.

Price sits just 0.56% above the 200-SMA, meaning this pivot is unresolved and requires confirmation. RSI at 59.07 is constructively trending but not yet overbought, leaving room to extend, while MACD at 0.53 above its signal 0.44 confirms positive momentum. The 50-SMA at 7.71 is well below price, indicating a healthy intermediate uptrend, but the tight proximity to the 200-SMA is the true decision line.
COST is coiling just above both its 50-SMA (950.58) and 200-SMA (958.50) at 961.10, with a bullish MACD crossover (1.91 vs 0.01 signal) marking a potential inflection back to trend. With price only 0.27% above the 200-day, the stock is threading a decision point between reclaim and rejection.

Price sits above both key moving averages, and the 50-SMA has curled up toward the 200-SMA — a constructive alignment even if not yet a golden cross. RSI at 55.49 is bullishly biased but far from overbought, leaving room to extend, while the widening MACD spread above signal confirms momentum has shifted positive. The tight 0.27% distance to the 200-SMA means this reclaim is still fragile and needs to hold to validate the long bias.
Ranked by technical inflection, profit-probability, and trade quality. Educational only. Not financial advice.