Monday Playbook — Top 5 Setups

The day's five highest-conviction setups, ranked by technical inflection, profit-probability, and trade quality — 5 long, 0 short. Trade your plan and manage risk first. Also screened: $FSLR, $NOW, $HIMS, $GOOGL, $SPY, $NVDA.

1$ASANTradedLongMedium convictionscore 78
Inflection73
Probability78
Quality86

ASAN is reclaiming its 200-day SMA (9.19) from below after a strong advance off the 50-day at 7.64, placing price at an inflection where a confirmed breakout could flip the long-term trend from resistance to support.
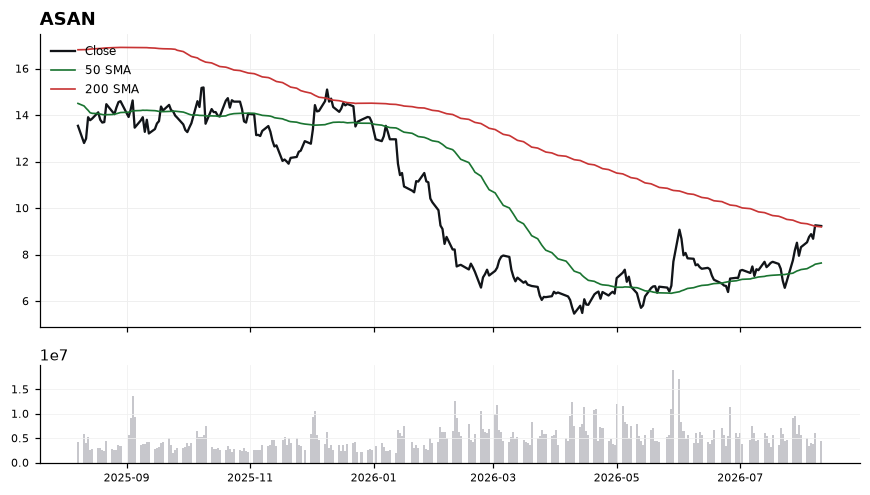
ASAN chart with 50 and 200 day moving averages

Price at 9.23 sits just 0.40% above the 200-SMA, with the 50-SMA (7.64) well below and rising — a bullish structural alignment. RSI at 66.69 signals strong momentum but is approaching overbought, warranting discipline on entries. MACD at 0.48 above signal 0.33 confirms momentum expansion, though the tight distance to the 200-SMA means this level must hold to validate the breakout thesis.

EntryPreferred entry on a pullback into 9.00–9.19 (retest of the 200-SMA as support), or on a momentum add above 9.40 with RSI holding >60.
InvalidationInvalidation on a daily close below 8.90; losing the 200-SMA reclaim would signal a failed breakout and revert bias to range-bound.
Targets10.20 (measured extension from 50-SMA base) → 11.00 (prior structural resistance zone)
TimeframeSwing (2-6 weeks)
2$HDTradedLongMedium convictionscore 76
Inflection64
Probability83
Quality86

HD is grinding higher above both key moving averages, with price at 350.78 sitting just 0.82% above the reclaimed 200-SMA at 347.94 — a classic post-reclaim inflection where the prior resistance is being retested as support.

HD chart with 50 and 200 day moving averages

Trend structure has flipped constructive: the 50-SMA (335.17) sits below spot but is curling up toward the 200-SMA (347.94), and price is holding above both. Momentum confirms the bias with RSI(14) at 57.25 — firmly bullish but not yet overbought — and MACD at 3.96 above its signal at 2.32, indicating expanding upside momentum. The tight 0.82% cushion to the 200-SMA is the tell: buyers must defend this line to keep the reclaim thesis intact. Technical-inflection score of 64.4 alongside a trade-quality score of 86.1 reflects a clean, high-probability continuation setup rather than a chase.

EntryPreferred accumulation zone 348.00–351.00 on constructive holds of the 200-SMA; secondary trigger on a decisive close above 353.00 to confirm breakout continuation.
InvalidationClosing break below 344.00 invalidates the setup — it would signal a failed 200-SMA reclaim and shift structure back toward the 50-SMA at 335.17.
Targets362.00 — measured continuation above the reclaim shelf → 372.00 — extension target as MACD momentum broadens
TimeframeSwing (2-6 weeks)
3$ALGNTradedLongMedium convictionscore 76
Inflection52
Probability98
Quality83

ALGN is coiling just above both key moving averages (50-SMA 174.75, 200-SMA 167.96) with price at 176.04, marking a low-volatility inflection where a neutral RSI of 51.9 and a MACD that has just crossed above its signal line (-0.63 vs -0.71) hint at a nascent momentum turn.

ALGN chart with 50 and 200 day moving averages

Price sits only 4.81% above the 200-SMA, keeping the long-term trend structurally intact while the 50-SMA reclaim confirms shorter-term stabilization. RSI at 51.9 is neutral-constructive, leaving room to run before overbought conditions emerge. MACD remains below zero but the bullish signal-line cross suggests downside momentum is fading. The technical-inflection score of 51.5 flags this as a genuine decision point rather than a confirmed trend.

EntryAccumulate on strength above 176.50 with confirmation on a close over 178.00; alternatively, fade pullbacks into the 174.75–175.00 zone (50-SMA support).
InvalidationDaily close below 172.50 invalidates the setup — it would break the 50-SMA, negate the MACD cross, and shift bias back toward retesting the 200-SMA at 167.96.
TargetsFirst target 182.50 (recent supply zone and initial momentum extension) → Second target 188.00–190.00 (measured move from the 50/200-SMA base)
TimeframeSwing (2-6 weeks)
4$CVNATradedLongMedium convictionscore 75
Inflection62
Probability83
Quality85

CVNA is trading at 74.16, above both its 50-SMA (66.76) and 200-SMA (72.32), with the price recently reclaiming the long-term trend line — a classic inflection where a prior downtrend transitions toward a confirmed uptrend.

CVNA chart with 50 and 200 day moving averages

Price sits just 2.54% above the 200-SMA, meaning the reclaim is fresh and must hold to validate the regime shift. The 50-SMA at 66.76 is tracking below the 200-SMA but rising, and MACD at 0.94 versus a signal of -0.14 confirms momentum has firmly turned positive. RSI at 62.60 shows strength without being overbought, leaving room to extend before mean-reversion pressure builds.

EntryPrefer entries on a controlled pullback into the 72.30–73.00 zone (retest of the 200-SMA), or on a momentum trigger via a decisive close above 74.50.
InvalidationA closing break below 71.50 invalidates the 200-SMA reclaim and would signal the inflection has failed, reverting bias to neutral.
TargetsFirst target 78.50, extending the current momentum leg → Second target 82.00, a measured move above the reclaimed trend
TimeframeSwing (2-6 weeks)
5$RKLBTradedLongMedium convictionscore 74
Inflection60
Probability83
Quality85

RKLB is coiling just above its rising 200-SMA at 78.05 while trading below a declining 50-SMA at 89.19, creating a classic pinch between long-term support and intermediate resistance. With MACD (-2.81) crossing above its signal (-5.84) and RSI at a neutral 53.2, momentum is inflecting higher from a corrective phase.

RKLB chart with 50 and 200 day moving averages

Price at 80.04 sits only 2.55% above the 200-SMA (78.05), the key line-in-the-sand that has framed the broader uptrend. The MACD improvement while still sub-zero signals early momentum recovery, not confirmation, and RSI at 53 leaves ample room before overbought conditions. The 50-SMA at 89.19 is the decisive overhead hurdle — reclaiming it would flip the intermediate structure back to bullish. Trade-quality (84.9) and profit-probability (83.0) scores support constructive positioning, but the inflection score of 60.4 argues for staged entries rather than full size.

EntryAccumulate on strength in the 80.00–82.00 zone with confirmation, or on a controlled pullback into 78.50–79.00 that holds the 200-SMA (78.05); trigger add-on above 83.50 on rising MACD.
InvalidationDaily close below 76.50 (roughly 2% under the 200-SMA) invalidates the long thesis — it would signal loss of the primary trend support and shift bias to neutral/defensive.
TargetsFirst target 88.50–89.20 into the 50-SMA resistance → Second target 94.00–96.00 on a confirmed 50-SMA reclaim
TimeframeSwing (2-6 weeks)

Ranked by technical inflection, profit-probability, and trade quality. Educational only. Not financial advice.