The 50-SMA at 37.40 sits well below the 200-SMA at 42.51, but price leadership above both averages signals a maturing uptrend with the 200-SMA now acting as dynamic support. Momentum confirms: MACD at 2.20 remains above its signal at 1.70, and RSI(14) at 66.99 is strong but approaching the 70 overbought threshold, suggesting upside is intact yet increasingly stretched. The narrow 2.93% cushion to the 200-SMA is the key tell — holding this zone keeps the Long bias structurally valid, while a loss would flip the read to distributive. Trade-quality (84.7) and profit-probability (78.0) scores support a constructive stance, though the inflection score (64.0) flags the need for confirmation, not chase.
Tuesday Playbook — Top 5 Setups
The day's five highest-conviction setups, ranked by technical inflection, profit-probability, and trade quality — 4 long, 1 short. Trade your plan and manage risk first. Also screened: $FIG, $AMZN, $GLW, $COST, $HIMS, $CRCL.
Inflection64
Probability78
Quality85
IBIT is extending a Long-biased trend at 43.76, holding above both the 50-SMA (37.40) and 200-SMA (42.51), with the price sitting just 2.93% above the long-term mean — an inflection zone where continuation must be defended or the trend risks reverting.

EntryPrefer staged entries on a pullback into 42.50–43.00 (200-SMA retest) or a momentum trigger on a decisive close above 44.00; avoid extension chases while RSI is >65.
InvalidationBelow 42.00 on a closing basis — breaking the 200-SMA cleanly would invalidate the Long thesis and signal a shift from trend-support to trend-resistance.
Targets45.50 — near-term extension of current momentum leg → 47.75 — measured continuation target as MACD spread widens
TimeframeSwing (2–6 weeks)
Inflection67
Probability69
Quality91
AVGO is pressing directly against its 200-day SMA at 369.55 with price at 369.68 (just 0.04% above), creating a textbook inflection where the long-term trend line either holds as support or fails. With the working bias Long and a trade-quality score of 90.6, this is a high-quality setup pending confirmation of a defense of the 200-SMA.
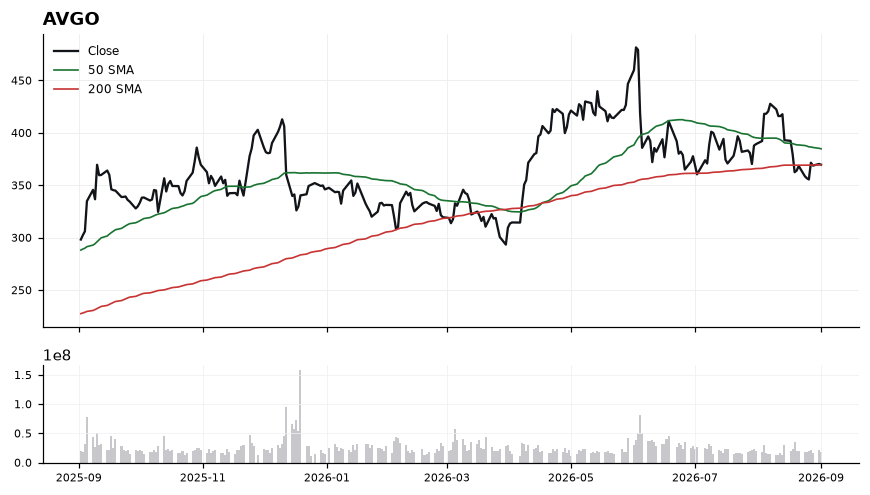
Price at 369.68 sits below the 50-SMA (384.84) but is fighting to hold the 200-SMA (369.55), signaling a pullback into major long-term support. RSI at 43.33 reflects controlled weakness — soft but not oversold — leaving room for a bounce without being stretched. MACD at -8.08 versus signal -6.41 confirms downside momentum is still active and has not yet crossed, so buyers need evidence before pressing. The 15-point gap between price and the 50-SMA defines the recovery runway if the 200-SMA holds.
EntryStaged accumulation zone 369.55–372.00 on evidence of stabilization above the 200-SMA; add-on trigger on a reclaim of 375.00 with MACD turning up toward its signal line.
InvalidationDaily close below 364.00 invalidates the setup — it would confirm a decisive loss of the 200-SMA (369.55) and shift structure from pullback-in-uptrend to trend break.
TargetsFirst target 384.84 at the 50-SMA, the primary mean-reversion objective → Second target 395.00–400.00 on a 50-SMA reclaim and MACD bullish cross
TimeframeSwing (2-6 weeks)
Inflection68
Probability69
Quality88
VRT is coiled right on its 200-day SMA (255.88) with price at 255.97, a classic inflection where the long-term trend line either holds as support or fails. Trade-quality scores 87.6 and technical-inflection 67.7 flag this as a high-signal decision zone within the AI Infrastructure theme.
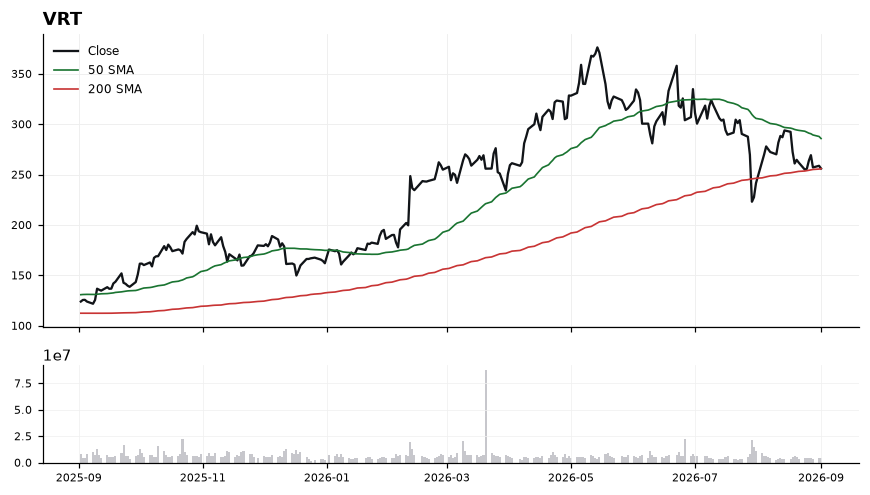
Price sits just 0.04% above the 200-SMA (255.88) while trading well below the 50-SMA at 285.78, signaling a medium-term pullback into long-term trend support. RSI at 41.89 is soft but not oversold, leaving room for a bounce without signaling capitulation. MACD at -7.28 vs signal -6.88 remains in bearish territory with a narrow negative gap, meaning momentum is still down but the spread is compressing — consistent with a stabilization attempt at the 200-SMA. A reclaim of the 50-SMA at 285.78 would be needed to confirm trend repair.
EntryStaged accumulation zone 254–258 on hold of the 200-SMA (255.88); confirmation add-on trigger on a daily close back above 262 with MACD histogram turning up.
InvalidationDaily close below 249 invalidates the setup — that would mark a decisive loss of the 200-SMA (255.88) and shift the structure from pullback to breakdown.
TargetsFirst target 278 (reversion toward the 50-SMA at 285.78) → Second target 292 (reclaim and extension above the 50-SMA)
TimeframeSwing (2-6 weeks)
Inflection68
Probability61
Quality94
GOOGL is pinned almost exactly on its 200-day SMA (335.05) with price at 335.02, creating a binary inflection where the bearish bias is still intact below the 50-SMA at 348.91 but downside momentum is decelerating.
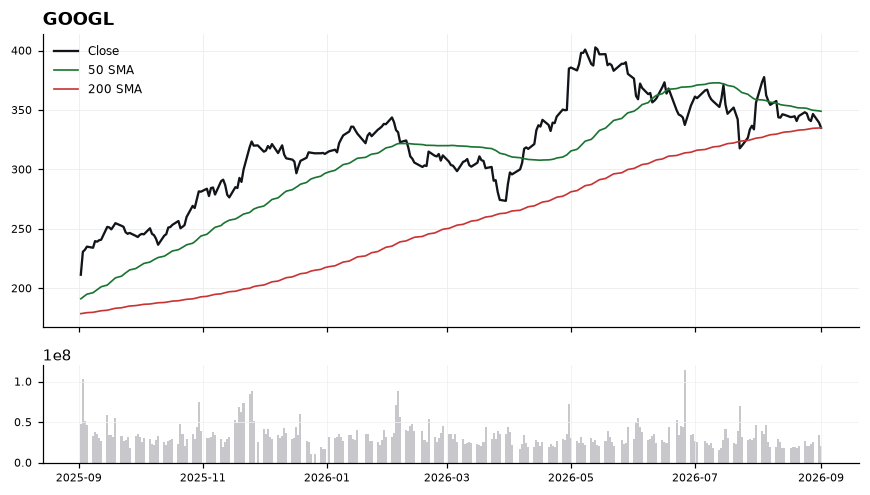
Price sits -0.01% from the 200-SMA, effectively testing the long-term trend line after rolling over from the 50-SMA. RSI at 41.25 is soft but not oversold, leaving room for further downside without a snapback signal, while MACD at -2.92 remains below its signal line at -2.20, confirming that short-term momentum is still deteriorating. The 50-SMA (348.91) sits ~4% overhead as clear dynamic resistance, framing a lower-high structure consistent with the short bias. A decisive close beneath the 200-SMA would open trend-change risk to the downside.
EntryShort-side triggers on either (a) a rejection rally into 342-349 (gap toward the 50-SMA at 348.91) or (b) a confirmed breakdown close below 334.00 (loss of the 200-SMA at 335.05).
InvalidationInvalidation on a sustained reclaim above 349.50; breaking that level would put price back above the 50-SMA, neutralize the MACD negative cross, and negate the lower-high thesis.
TargetsFirst target 325.00 (measured move below the 200-SMA on breakdown confirmation) → Second target 315.00 (extension objective if momentum accelerates with RSI pushing toward oversold)
TimeframeSwing (2-6 weeks)
Inflection55
Probability83
Quality84
BMNR is trading at 23.37, holding above both its reclaimed 200-SMA (22.45) and rising 50-SMA (17.82), placing the tape at a decision point where continuation would confirm a trend transition off the longer-term mean.
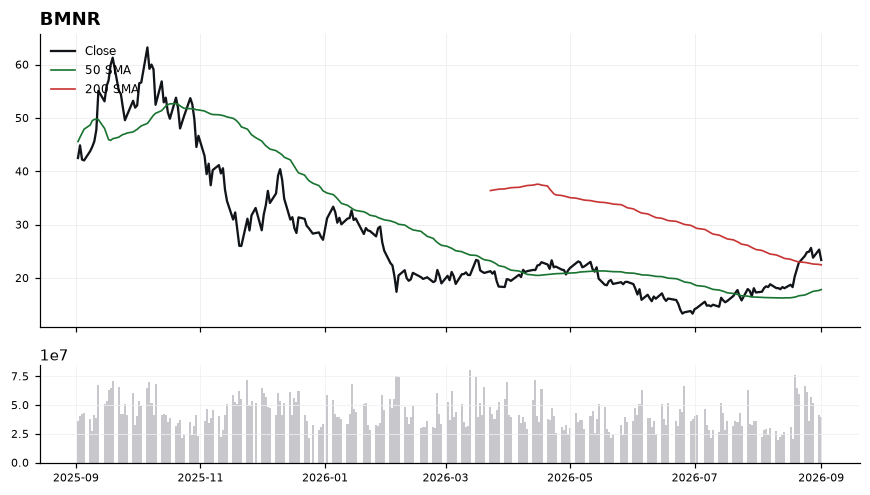
Price sits just 4.08% above the 200-SMA, a tight cushion that keeps this classified as an early-stage reclaim rather than an extended move. RSI at 60.42 shows constructive momentum without reaching overbought, while MACD at 2.00 over its 1.70 signal line confirms positive momentum crossover. The 50-SMA (17.82) trailing well below price indicates the shorter trend has already turned up, but the modest distance to the 200-SMA means any slip could quickly retest that pivot.
EntryPreferred accumulation zone 22.80–23.10 on pullback toward the 200-SMA (22.45); alternative trigger on strength through 24.00 with MACD spread expansion.
InvalidationClosing break below 22.00 invalidates the 200-SMA reclaim thesis and would flip the structure back into range/distribution below the long-term mean.
Targets25.50 — prior supply / measured extension from the 200-SMA reclaim → 28.00 — trend-continuation objective as MACD momentum carries price further above the 50/200 SMAs
TimeframeSwing (2-6 weeks)
Ranked by technical inflection, profit-probability, and trade quality. Educational only. Not financial advice.