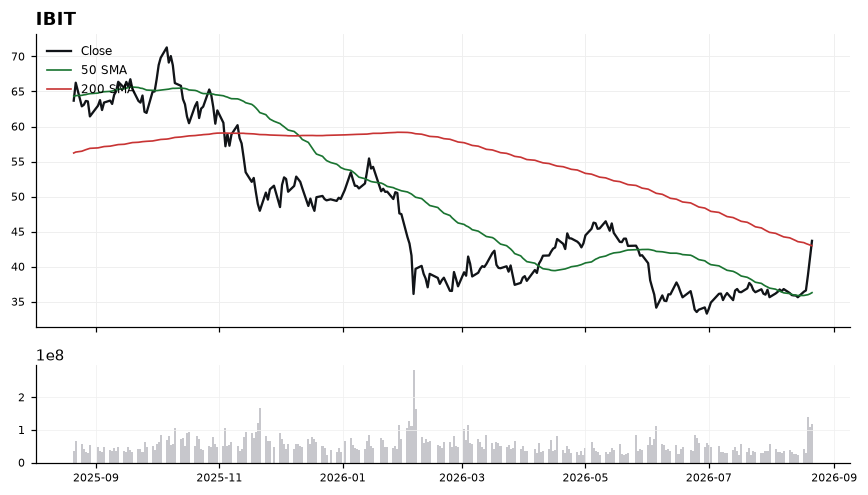
The 50-SMA sits materially below price at 36.28, confirming the medium-term uptrend, while the 200-SMA at 43.00 has flipped from resistance to nearby support. MACD's positive spread of 0.72 above signal validates trend acceleration, but RSI at 79.54 is deep in overbought territory, historically consistent with pullbacks or consolidation. The narrow 1.59% cushion to the 200-SMA means any mean reversion tests that line quickly, making it the pivotal level for the working bias. Trade-quality (85.6) and profit-probability (78.0) scores are constructive, but the overbought RSI supports a Watch stance rather than chase.
Sunday Playbook — Top 5 Setups
The day's five highest-conviction setups, ranked by technical inflection, profit-probability, and trade quality — 4 long, 0 short. Trade your plan and manage risk first. Also screened: $POET, $CRCL, $COST, $CRM, $AKAM, $AVGO.
IBIT trades at 43.68, just 1.59% above its 200-SMA (43.00) and well above its 50-SMA (36.28), marking a momentum breakout retest zone. With RSI at 79.54 and MACD (0.96) crossed above signal (0.24), the tape is at an inflection between trend continuation and short-term overextension.
CAVA is trading at 73.63, holding above both its 50-SMA (72.23) and 200-SMA (71.19) with the MACD (0.69) crossed decisively above its signal line (-0.62), marking an inflection where a stacked-moving-average base is attempting to transition into trend continuation.

Price sits 3.42% above the 200-SMA and roughly 1.9% above the 50-SMA, a constructive but not extended posture that leaves room to work. RSI at 58.22 is firmly in bullish territory without being overbought, consistent with the positive MACD spread of ~1.31 pointing to expanding momentum. The 50-SMA at 72.23 and 200-SMA at 71.19 form a tight support shelf, so the tape is essentially pivoting off that band. A technical-inflection score of 55.9 with trade-quality at 78.7 reflects a setup that is confirmed but still early in its move.
GLD is extended in a confirmed uptrend, printing 423.36 with price stacked above both the 50-SMA (383.03) and 200-SMA (413.46). The inflection is tactical: momentum is strong but overbought, so the working long bias is best expressed on controlled pullbacks rather than breakout chases.

Trend structure is intact — the 50-SMA sits ~8% above the 200-SMA (golden-cross alignment) and price holds a 2.39% cushion over the 200-day at 413.46. MACD at 9.61 above its 6.48 signal line confirms positive momentum, but RSI at 71.16 is in overbought territory, historically a zone where pullbacks or sideways digestion resolve the excess. Immediate support layers to watch: the reclaimed 200-SMA at 413.46, then a deeper mean-reversion band toward the 50-SMA at 383.03. Trade-quality (85) and profit-probability (78) scores support the long thesis, while technical-inflection (68.9) argues for staged entries, not full size at highs.
FIG is grinding higher above a rising 50-SMA (22.46) and has just reclaimed its 200-SMA (26.72), putting price at a classic trend-transition inflection with the working bias tilted long.

At 27.10, price sits only 1.41% above the 200-SMA, framing that level as the pivotal line between accumulation and re-distribution. The 50-SMA at 22.46 is well below spot, confirming shorter-term uptrend structure, while RSI at 58.85 shows momentum expanding but not yet overbought. MACD at 1.10 over signal 0.99 keeps the momentum cross constructive, though the narrow spread argues the move still needs confirmation rather than chase.
VRT is testing its long-term trend, trading at 261.95 just 3.47% above the rising 200-SMA (253.17) while remaining well below the 50-SMA (293.89) — a classic pullback-to-support inflection within the AI infrastructure theme.

Price is caught between a broken 50-SMA at 293.89 acting as overhead resistance and the 200-SMA at 253.17 acting as the line-in-the-sand support. RSI(14) at 42.18 shows corrective weakness but is not yet oversold, leaving room for either a bounce or a final flush. MACD at -5.87 has crossed above its signal at -5.97, a tentative early momentum improvement that still requires price confirmation. The narrow 3.47% cushion to the 200-SMA makes this a high-reward-to-risk decision zone where the next move likely sets the swing bias.
Ranked by technical inflection, profit-probability, and trade quality. Educational only. Not financial advice.