Price at 79.16 sits only 0.78% above the 200-SMA, making that level the critical line-in-the-sand for the long thesis. RSI at 51.26 is neutral but curling higher, and MACD at -0.05 versus a signal of -2.01 shows a decisive bullish cross confirming momentum has flipped from negative to constructive. The 50-SMA at 84.16 caps the upside and defines the resistance that bulls must overcome to validate a trend change. Trade-quality (86.1) and profit-probability (83.0) scores support the long bias, but the tight proximity to the 200-SMA means risk is well-defined either way.
Tuesday Playbook — Top 5 Setups
The day's five highest-conviction setups, ranked by technical inflection, profit-probability, and trade quality — 5 long, 0 short. Trade your plan and manage risk first. Also screened: $RH, $HD, $SPY, $IGV, $ALGN, $AKAM.
Inflection65
Probability83
Quality86
RKLB is coiling just above its 200-day SMA (78.55) while trading below the 50-day (84.16), setting up a classic inflection where a reclaim of the mid-range decides the next swing.
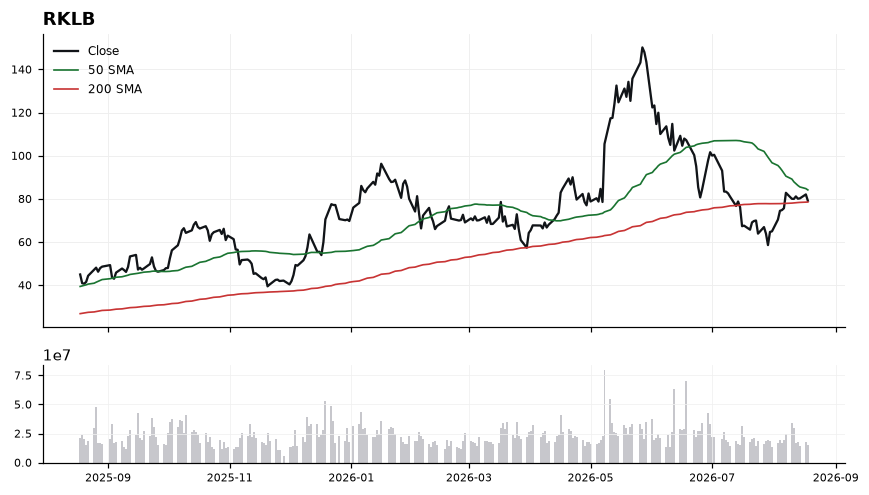
EntryPreferred entry on a hold of 78.55-79.50 with confirmation, or on a breakout close above 80.50 to signal momentum acceleration.
InvalidationDaily close below 77.00 invalidates the setup; losing the 200-SMA would flip structure back to bearish and negate the MACD cross signal.
TargetsFirst target 84.00-84.50 at the 50-SMA confluence → Second target 88.50 on a clean 50-SMA reclaim
TimeframeSwing (2-6 weeks)
Inflection63
Probability83
Quality86
ASAN has reclaimed its 200-day SMA (9.04) with price at 9.16, marking a potential trend-transition inflection after basing above the rising 50-day SMA (7.76). The tape is at a decision point where a hold above the long-term average would confirm the shift.
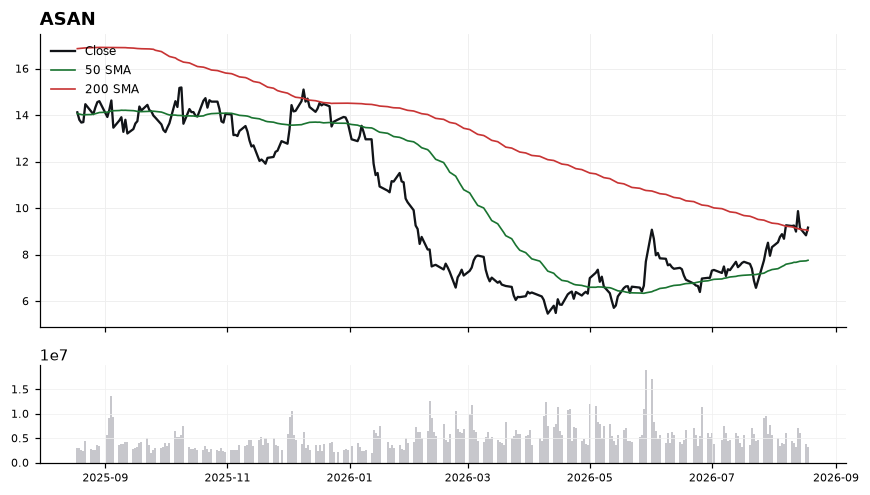
Price sits just 1.34% above the 200-SMA, with the 50-SMA (7.76) tracking well below — a bullish structural gap that argues the intermediate trend is turning. RSI at 58.3 is constructively above the mid-line but not yet overbought, leaving room to extend. MACD (0.47) is fractionally above its signal (0.46), a fresh but still-fragile momentum cross that needs confirmation. Overall, the technical-inflection score of 63.3 aligns with a setup that is emerging rather than mature.
EntryConsider staged entries on either a hold of the 9.00–9.10 shelf (retest of the 200-SMA at 9.04) or a momentum trigger on a close above 9.30.
InvalidationA decisive close back below 8.80 would invalidate the reclaim of the 200-SMA and signal the breakout attempt has failed, returning price to the prior range.
TargetsFirst target 9.90 — measured extension from the 200-SMA reclaim → Second target 10.80 — continuation objective if momentum broadens
TimeframeSwing (2-6 weeks)
Inflection61
Probability83
Quality87
CRWV is coiling just above both key moving averages, with price at 93.17 sitting 0.65% above the 200-SMA (92.57) and roughly 3% above the 50-SMA (90.47). This convergence marks a technical inflection where a reclaim of trend is being tested in real time.
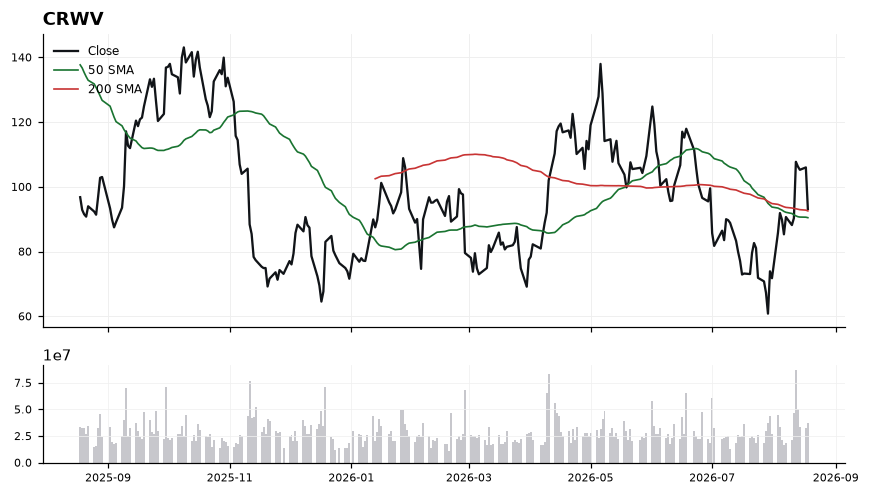
The 50-SMA has crossed back above the 200-SMA in proximity, and price is holding above both, a constructive alignment. MACD at 4.34 versus signal 1.75 shows a wide positive spread, confirming momentum has expanded to the upside. RSI at 52.11 is neutral-constructive, leaving room to trend higher without overbought risk. The tight distance to the 200-SMA (0.65%) means this level is the pivotal line in the sand for the working long bias.
EntryPreferred accumulation zone 92.60–93.20 on a hold of the 200-SMA; alternative trigger on a decisive close above 94.50 to confirm breakout continuation.
InvalidationInvalidation on a daily close below 90.00, which would break the 50-SMA (90.47) and negate the reclaim thesis, signaling failure of the inflection setup.
TargetsFirst target 98.50, a measured extension from the moving-average base → Second target 104.00, aligned with continuation of the MACD momentum expansion
TimeframeSwing (2-6 weeks)
Inflection65
Probability83
Quality81
COST is coiling just above both its 50-SMA (949.99) and 200-SMA (958.89) at 961.35, sitting only 0.26% above the long-term trend line — a classic inflection where reclaimed moving averages need to prove themselves as support.
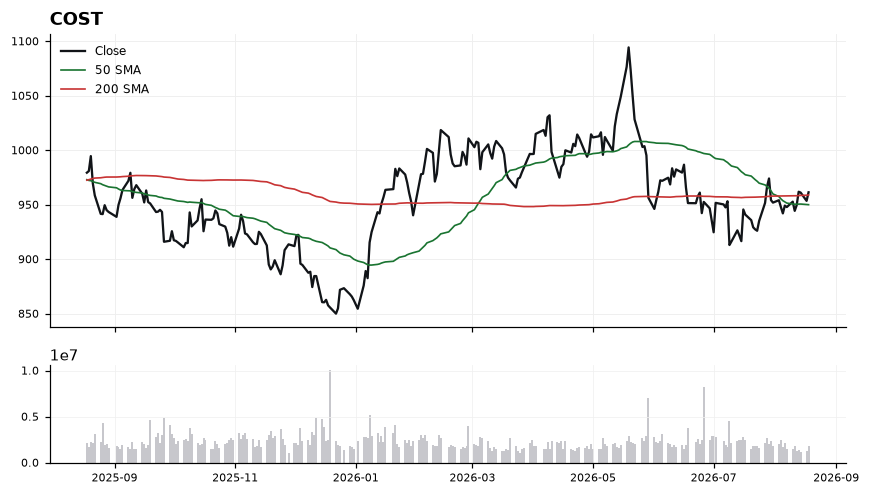
Price is stacked constructively with the 50-SMA now below the 200-SMA proximity and both trailing spot, while RSI at 55.1 shows firming momentum without being stretched. MACD at 2.49 versus signal 0.81 confirms a fresh positive crossover with widening spread, supporting the long bias. However, the razor-thin 0.26% cushion over the 200-SMA leaves little margin for error, making the 949–959 zone the pivotal battleground.
EntryPrefer entries on a controlled pullback into the 958–962 zone (retest of the 200-SMA), or on a momentum trigger via a decisive close above 968.
InvalidationClose below 949 (under the 50-SMA); a break there voids the moving-average reclaim and shifts structure back to neutral/bearish.
TargetsFirst target 985 (measured extension from the 50/200-SMA base) → Second target 1005 (psychological round-number and next momentum objective)
TimeframeSwing (2-6 weeks)
Inflection63
Probability69
Quality89
AVGO is trading at 380.00, wedged between its 50-SMA at 389.82 (overhead) and its 200-SMA at 369.27 (below), sitting just 2.91% above the long-term trend line. With a trade-quality score of 88.7 and RSI at 41.20, the name is pulling back into a decision zone rather than breaking down.
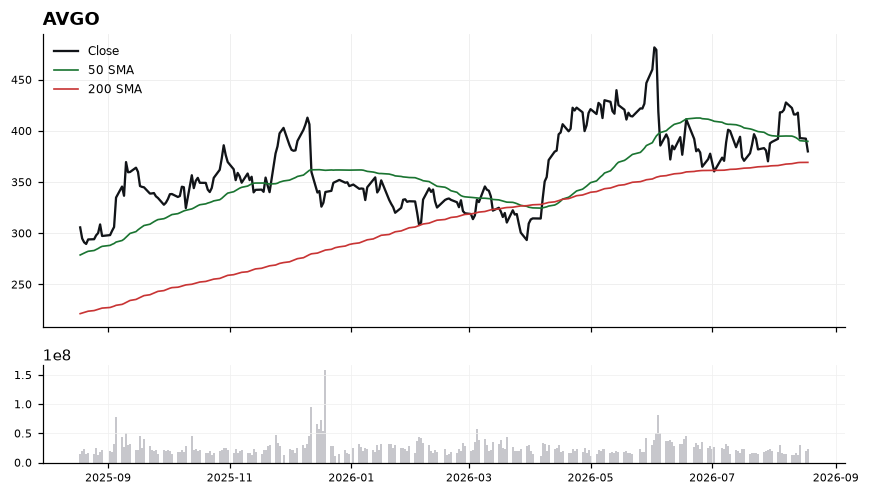
Price has slipped below the 50-SMA (389.82), signaling a short-term loss of momentum, but remains constructively above the rising 200-SMA (369.27), keeping the primary uptrend intact. MACD at 2.66 has crossed beneath its signal line at 5.29, confirming near-term downside pressure, while RSI at 41.20 is compressed but not yet oversold — leaving room for a further test lower before mean reversion. The setup is a classic pullback-to-support scenario: technical-inflection score of 63.2 reflects a genuine crossroads where 369-380 must hold to preserve the long bias.
EntryStaged accumulation zone 371.00–378.00, with confirmation trigger on a reclaim of 382.50 on rising momentum (MACD histogram narrowing). Avoid chasing into the 50-SMA at 389.82 without a clean break.
InvalidationDaily close below 365.00 (roughly 1.2% under the 200-SMA at 369.27). Breaking this level invalidates the long thesis by breaching the primary trend anchor and would shift the structure to lower-highs.
Targets389.82 — reclaim of the 50-SMA (first resistance and momentum confirmation) → 402.00 — extension above the 50-SMA into prior supply, ~5.8% upside
TimeframeSwing (2–6 weeks)
Ranked by technical inflection, profit-probability, and trade quality. Educational only. Not financial advice.