Price sits just 0.54% above the 200-day, keeping the long-term trend intact while the 50-day caps immediate upside at 169.31. RSI at 53.08 is constructively neutral with room to run before overbought conditions. MACD at -0.17 versus signal at -1.76 shows a clear bullish crossover with momentum inflecting upward from negative territory. The tight SMA cluster (spread <1%) signals volatility compression that historically precedes an expansion move.
Tuesday Playbook — Top 5 Setups
The day's five highest-conviction setups, ranked by technical inflection, profit-probability, and trade quality — 4 long, 0 short. Trade your plan and manage risk first. Also screened: $IBIT, $GLD, $AMZN, $META, $SPY, $SOXL.
Inflection67
Probability83
Quality85
QCOM is coiling directly between its 50-SMA (169.31) and 200-SMA (167.83) with price at 168.74, a compression zone where a directional resolution typically follows. Trade-quality (84.6) and profit-probability (83.0) scores frame this as a high-grade long-bias setup at technical inflection (67.3).
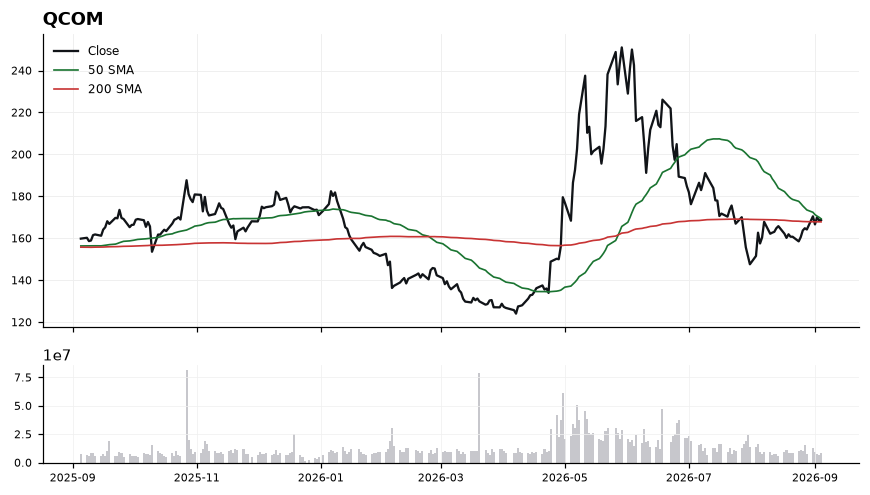
EntryPrimary trigger on a reclaim and close above the 50-SMA at 169.31, ideally with confirmation above 170.00. Secondary entry on a pullback hold of the 200-SMA at 167.83.
InvalidationInvalidation on a decisive close below 166.50, which would break the 200-SMA support and negate the bullish MACD crossover, flipping the trend structure back to distribution.
TargetsFirst target 173.50, prior resistance and measured move from the SMA compression → Second target 177.00, extension objective if momentum expands with RSI breaking above 60
TimeframeSwing (2-6 weeks)
Inflection59
Probability83
Quality85
CVNA is trading at 74.59, holding above both its 50-SMA (68.77) and 200-SMA (73.03), signaling a reclaim of longer-term trend structure. With MACD (1.54) just barely crossing its signal (1.53) and RSI at 56.46, the setup sits at an early inflection where trend confirmation is still forming.
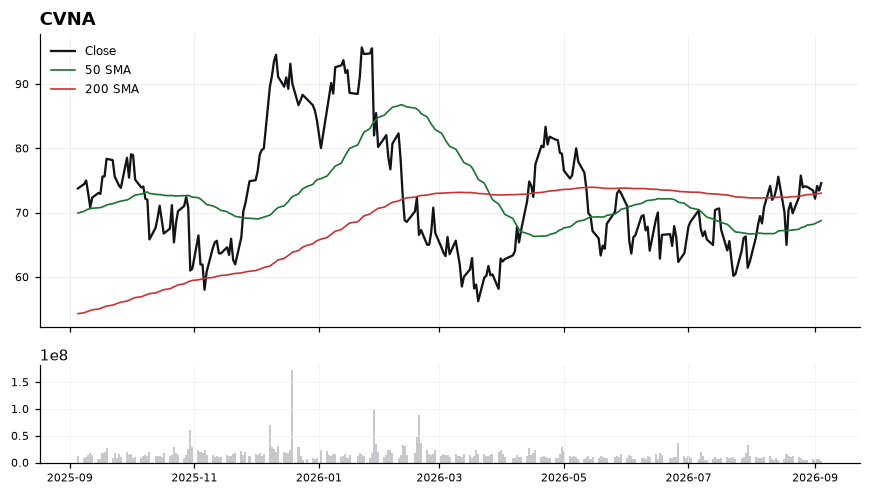
Price is 2.14% above the 200-SMA, a thin but constructive cushion that must hold to preserve the long bias. The 50-SMA at 68.77 sits well below price, confirming intermediate-term uptrend, while RSI at 56.46 shows room to run before overbought conditions. The MACD/signal spread is razor-thin (1.54 vs 1.53), meaning momentum is inflecting but not yet decisive. Technical-inflection score of 59.2 paired with trade-quality of 85.2 suggests a favorable risk/reward if follow-through confirms.
EntryPreferred entry on a pullback into 73.00–73.50 (retest of 200-SMA) or on a momentum trigger above 75.50 confirming MACD expansion.
InvalidationBelow 71.50 on a closing basis; a break invalidates the 200-SMA reclaim and signals loss of trend structure, flipping bias to neutral.
TargetsFirst target 78.50, capturing extension off the 50-SMA base → Second target 82.00, projecting continuation if momentum broadens
TimeframeSwing (2-6 weeks)
Inflection63
Probability69
Quality93
GOOGL is coiling just above its rising 200-SMA at 335.94 while trading below the 50-SMA at 348.57, setting up an inflection where the working long bias hinges on the 200-day holding as support.
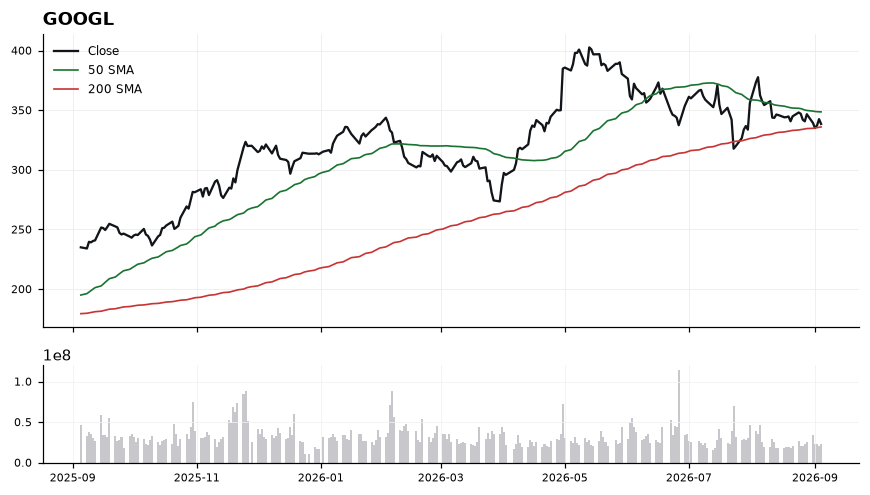
Price at 338.46 sits only 0.75% above the 200-SMA (335.94), a historically pivotal zone that is now the line in the sand for trend continuation. RSI at 44.82 is neutral-to-soft but not oversold, indicating momentum has cooled without capitulation, while MACD at -2.98 below its signal of -2.60 confirms bearish momentum is still active. The 50-SMA at 348.57 caps the tape overhead, so the setup favors patience: either a reclaim of the 50-day or a successful defense of the 200-day is needed to re-engage the long thesis, supported by a trade-quality score of 93.1.
EntryTiered long: initial probe on a hold/reclaim of 336-339 (200-SMA zone) with confirmation, add on a decisive close back above the 50-SMA at 348.57.
InvalidationDaily close below 332.50 invalidates the setup, as it would breach the 200-SMA and signal a trend regime shift from support to resistance.
TargetsFirst target 348.50 (50-SMA reclaim / prior pivot) → Second target 358-362 (measured extension above the 50-SMA)
TimeframeSwing (2-6 weeks)
Inflection64
Probability78
Quality79
MSTR is trading at 142.80, just 2.67% above the reclaimed 200-SMA at 139.09, with the 50-SMA (103.50) sitting well below price — a classic post-basing trend transition where the prior long-term ceiling is being tested as new support.
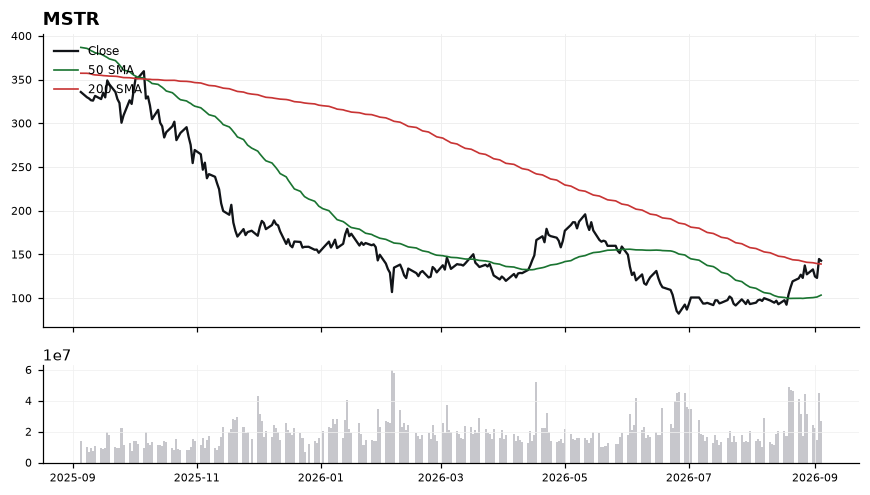
The uptrend structure is intact: price > 50-SMA > 200-SMA, with the 50-day nearly 38 points below spot signaling strong intermediate momentum. MACD at 9.91 versus signal 7.20 confirms an active bullish crossover with widening histogram, while RSI at 66.20 is firm but not yet extended past the 70 overbought threshold. The tell is whether 139.09 (200-SMA) holds on any pullback — that level converts from resistance to trend support and defines the inflection.
EntryPrefer staged entries on a pullback into the 139–141 zone (retest of the 200-SMA at 139.09), or a breakout confirmation on a daily close above 145.50 with RSI holding >60.
InvalidationDaily close below 135.00 invalidates the setup; that would mean losing the 200-SMA reclaim and signaling the breakout was a failed retest, flipping bias to neutral.
TargetsFirst target 155.00 (measured extension from the 200-SMA reclaim) → Second target 168.00 (trend continuation zone)
TimeframeSwing (2-6 weeks)
Inflection70
Probability61
Quality87
ASAN is coiled precisely at its 200-day SMA (8.81), with price sitting exactly on the long-term trend divider while the 50-SMA (8.42) rises beneath — a textbook inflection where a decisive break resolves the range.
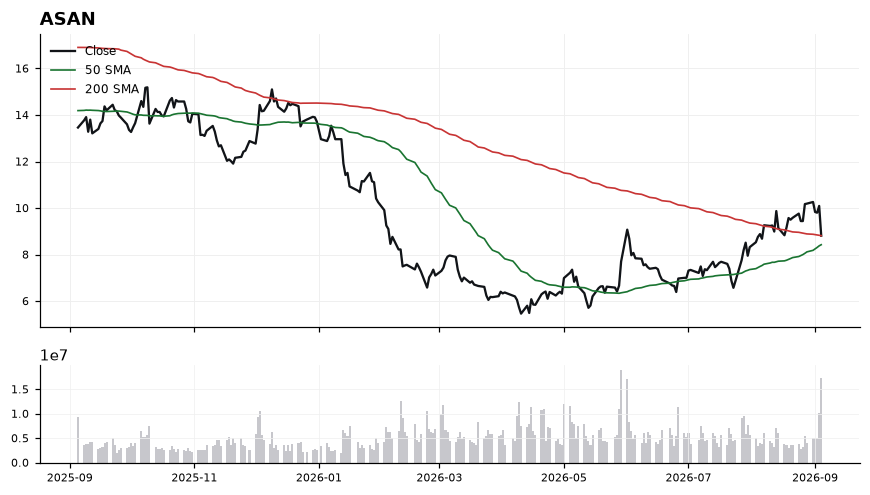
Price at 8.81 is 0.04% below the 200-SMA (8.81) but holds a 4.6% cushion over the rising 50-SMA (8.42), signaling a constructive intermediate structure pressing against long-term resistance. RSI at 45.2 is neutral-to-soft, indicating no momentum thrust yet to confirm a breakout. MACD at 0.36 remains below its signal (0.46), a near-term deceleration flag that argues for patience over anticipation. Net read: bullish base, unconfirmed trigger — hence a Watch stance rather than initiation.
EntryTrigger long on a daily close above 8.95 (clean reclaim of the 200-SMA at 8.81 with follow-through); preferred add-zone on pullback retest of 8.55–8.65 that holds.
InvalidationInvalidation on a daily close below 8.40 — this breaks the 50-SMA support and negates the higher-low structure, reverting bias to neutral/bearish.
TargetsFirst target 9.35 (prior swing supply, ~6% above trigger) → Second target 9.85 (measured extension from the 50/200-SMA base)
TimeframeSwing (2-6 weeks)
Ranked by technical inflection, profit-probability, and trade quality. Educational only. Not financial advice.