Price reclaiming both the 50-SMA (8.16) and 200-SMA (8.15) shifts the intermediate structure constructive, and the near-flat separation of those averages signals a trend reset rather than a decisive breakout. RSI at 52.58 is neutral-with-upward-bias, leaving room to run before overbought conditions. MACD at -0.21 has just nosed above its signal at -0.22, a nascent bullish cross that still needs to cross zero to confirm momentum. Trade-quality 79.7 and inflection score 62.1 support a long lean, but the thin 1.93% cushion above the 200-SMA keeps risk tight.
Wednesday Playbook — Top 5 Setups
The day's five highest-conviction setups, ranked by technical inflection, profit-probability, and trade quality — 5 long, 0 short. Trade your plan and manage risk first. Also screened: $TXRH, $IBIT, $SHOP, $ASAN, $AVGO, $AMZN.
Inflection62
Probability98
Quality80
POET is coiling just above its 50- and 200-day SMAs (8.16/8.15), with price at 8.31 sitting only 1.93% above long-term trend — a classic inflection where the moving averages have compressed and either resolve into trend continuation or fail back into the base.
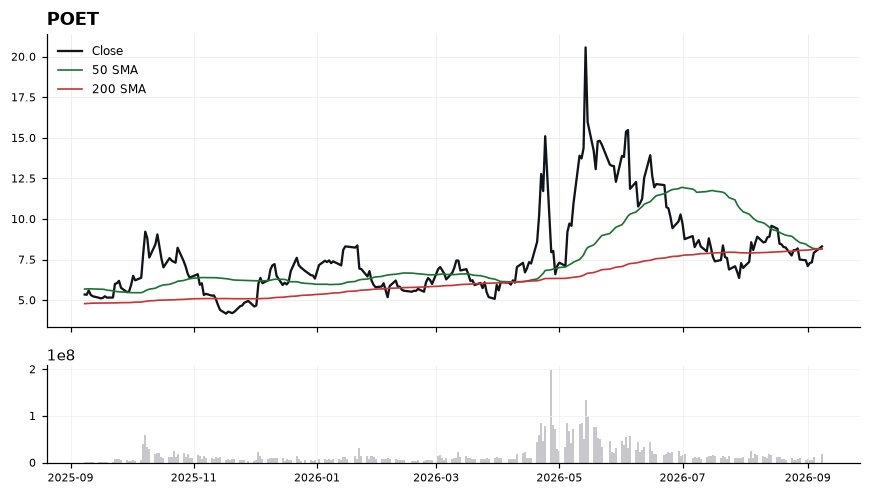
EntryAccumulation zone 8.20–8.35 on holds above the 50-SMA (8.16); add-on trigger on a decisive close above 8.50 to confirm MACD crossing zero.
InvalidationDaily close below 8.05, which would break both the 50- and 200-SMA cluster (8.15–8.16) and invalidate the reclaim thesis, flipping structure back to bearish.
Targets8.75 — first resistance and prior swing pivot, ~5.3% above spot → 9.20 — extension target, ~10.7% above spot and a stretch of the reclaimed trend
TimeframeSwing (2-6 weeks)
Inflection56
Probability98
Quality83
QCOM is trading at 174.09, holding above both its 50-SMA (169.01) and 200-SMA (167.87) with a bullish MACD crossover (0.48 vs -1.32) — a constructive alignment for the Long bias as momentum turns while price sits only 3.70% above long-term trend.
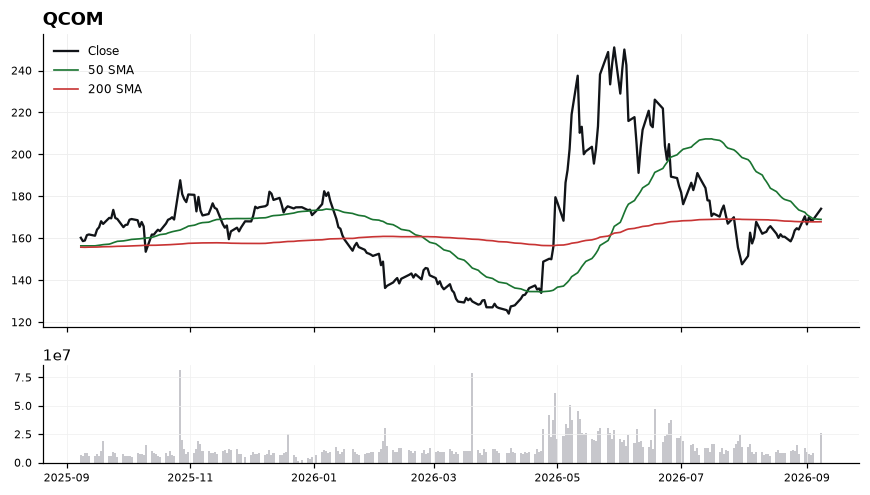
Price leads both moving averages, and the 50-SMA has cleared the 200-SMA, framing a trend-supportive structure. RSI at 58.92 is firmly bullish but not yet overbought, leaving room before momentum exhaustion. The MACD line has crossed well above its signal, confirming the recent inflection off the 167.87–169.01 support shelf. Trade-quality scores 82.6 and profit-probability 98.0 reinforce the setup, though technical-inflection at 55.5 suggests the move is developing rather than explosive.
EntryPreferred accumulation on a pullback into the 170.00–171.50 zone (just above the 50-SMA at 169.01); alternatively, a momentum trigger on a decisive close above 175.50.
InvalidationInvalidation on a daily close below 166.50, which would break the 200-SMA (167.87) and negate the bullish MA stack and MACD signal.
TargetsFirst target 180.00 as initial extension above prior consolidation → Second target 185.50 on continuation as RSI approaches overbought
TimeframeSwing (2-6 weeks)
Inflection60
Probability83
Quality85
IREN is a Traded name with a working long bias, printing 46.93 after reclaiming its 200-SMA (45.65) while riding well above the 50-SMA (40.22). The MACD flip to +0.35 versus a -0.29 signal marks a fresh momentum inflection just 2.8% above the long-term trend line.
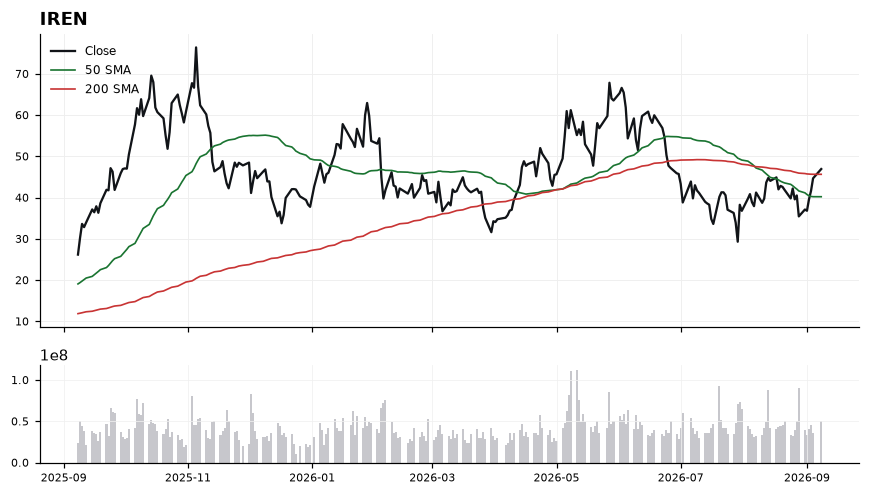
Price sits above both moving averages with the 50-SMA (40.22) still below the 200-SMA (45.65), so the setup is an early trend-repair rather than a confirmed golden cross. RSI at 60.4 shows constructive momentum without being stretched, leaving room before the 70 overbought zone. The MACD cross into positive territory (0.35 vs -0.29) confirms buyers regained control, and the recent recapture of the 45.65 pivot is the key technical event. However, the trade-quality score of 84.8 sits against a more middling technical-inflection score of 59.7, arguing for disciplined entries rather than chasing.
EntryPreferred entry on pullbacks into the 45.65-46.20 zone (retest of the 200-SMA); momentum add above 47.20 on a decisive push through recent highs.
InvalidationClosing break below 43.50 invalidates the reclaim thesis — it would put price back under the 200-SMA and threaten a return toward the 50-SMA at 40.22.
Targets50.50 — near-term measured move extension from the 200-SMA reclaim → 54.00 — swing extension if momentum broadens and MACD trend persists
TimeframeSwing (2-6 weeks)
Inflection59
Probability83
Quality85
CVNA is grinding higher at 74.72, reclaiming its 200-SMA (73.08) and extending above its rising 50-SMA (69.02), placing it at a trend-confirmation inflection where a sustained hold flips the longer-term structure constructive.
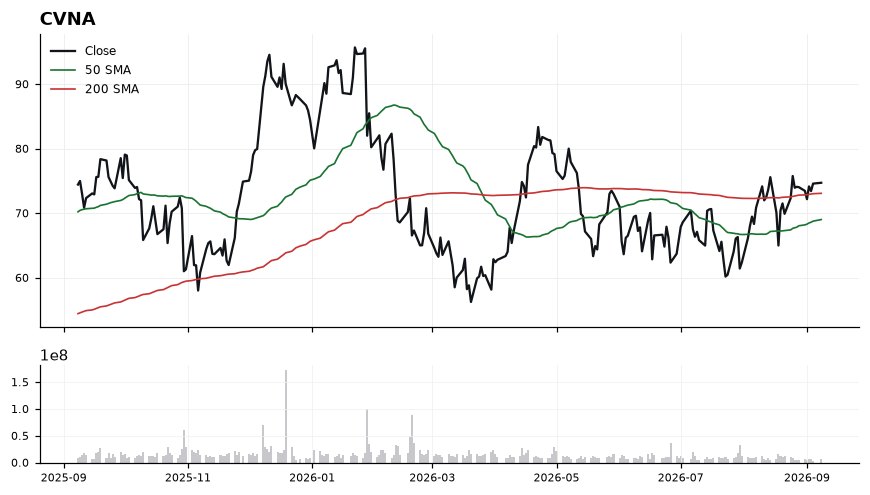
Price sits 2.24% above the 200-SMA with the 50-SMA now below the 200-SMA but curling up, an early bullish alignment that still needs confirmation. RSI at 56.70 shows positive momentum without stretched conditions, leaving room to run before overbought. MACD at 1.55 versus signal 1.53 is a fresh but narrow positive cross, so follow-through is required to validate the impulse. Trade-quality (85.1) and profit-probability (83.0) support the working long bias, but the modest technical-inflection score (59.0) argues for disciplined entry rather than chasing.
EntryPreferred entry on a pullback into 73.00-73.50 (retest of the 200-SMA), or on a momentum trigger via a decisive close above 75.50.
InvalidationInvalidation on a daily close below 69.00; a break there loses the 50-SMA and negates the higher-low structure, reverting bias to neutral.
TargetsFirst target 79.50 (near-term momentum extension) → Second target 84.00 (measured continuation of the reclaim)
TimeframeSwing (2-6 weeks)
Inflection64
Probability69
Quality93
GOOGL is coiling directly on top of its 200-day SMA (336.21) with a working long bias, sitting just 0.64% above this key trend line while the 50-day (348.59) caps rallies overhead — a classic inflection between trend support and mean-reversion resistance.
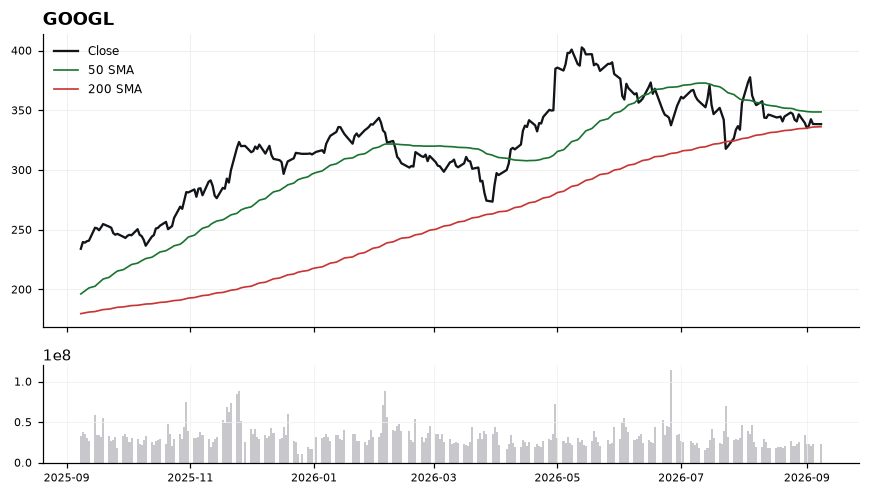
Price at 338.36 is sandwiched between the rising 200-SMA (336.21) below and the 50-SMA (348.59) above, framing a ~3% compression zone. RSI(14) at 44.75 is neutral-soft, showing no oversold rescue but also no distribution pressure. MACD at -3.02 remains below its signal (-2.68) and negative, confirming near-term momentum is still fading and any long entry is counter-trend to the current momentum print. The trade-quality score of 93.2 combined with the tight 200-SMA proximity argues this is a high-reward reclaim setup — but only if the 200-SMA holds.
EntryTiered long: initial probe on a reclaim/hold of 340 with confirmation, add on a reclaim of the 50-SMA at 348.59. Alternative: pullback entry into 336.50–337.50 (200-SMA retest) with a bullish reversal signal.
InvalidationDaily close below 333.00 (roughly 1% under the 200-SMA). A decisive break of the 200-SMA at 336.21 invalidates the long thesis and shifts structure from consolidation to trend-loss.
Targets355.00 — reclaim of the 50-SMA (348.59) and prior supply shelf → 365.00 — extension target on MACD bullish cross confirmation
TimeframeSwing (2-6 weeks)
Ranked by technical inflection, profit-probability, and trade quality. Educational only. Not financial advice.