Price at 270.87 sits just 2.06% above the 200-SMA (265.40), with RSI(14) at 36.51 signaling oversold conditions but not yet washout territory. MACD at -8.09 remains below its signal at -5.12, confirming momentum is still negative and any long entry is counter-trend to the short-term slope. The 50-SMA at 311.10 is now overhead resistance roughly 15% away, framing the recovery ceiling, while the 200-SMA acts as the pivot line separating a constructive higher-low setup from trend failure.
$LRCX
LongTechnical snapshot
as of Sep 15, 2026Chart
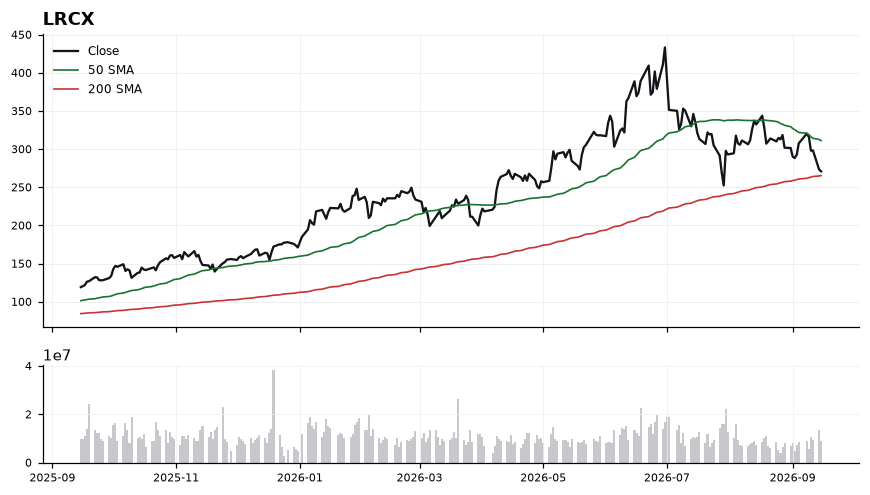
Daily close with 50/200-day SMA and volume · Sep 15, 2026
Latest read
From the Sep 16, 2026 Playbook →Compare LRCX with
All Semiconductors →Related:$AMAT
LRCX — frequently asked
- Is LRCX above its 200-day moving average?
- Yes — $LRCX is trading 2.10% above its 200-day moving average (around 265.40), which reflects a long-term uptrend. (Educational only, not financial advice.)
- Is LRCX overbought or oversold?
- LRCX's 14-day RSI is 37, which is neutral. RSI above 70 is overbought, below 30 is oversold, and in between is neutral. (Educational only, not financial advice.)
- What is LRCX's RSI?
- LRCX's current 14-day RSI is 37 (neutral). (Educational only, not financial advice.)
- Is LRCX in an uptrend or a downtrend?
- LRCX's 50-day moving average (311.10) is above its 200-day (265.40), a bullish (golden-cross) structure. (Educational only, not financial advice.)
- What is the latest read on LRCX?
- Our most recent Daily Playbook reads LRCX as Long (#3 · Long · 270.87). (Educational only, not financial advice.)
Get LRCX signals the moment they fire
Daily Playbook reads, real-time technical alerts, and human-vetted AI analysis across the market's leaders.
Educational only. Not financial advice. Technicals are end-of-day and may lag live prices.