Trend structure is constructive: price at 44.72 sits above both the rising 50-SMA (36.63) and 200-SMA (42.86), a classic bullish alignment. MACD at 1.72 versus signal 0.72 confirms upside momentum, but RSI 81.36 is well into overbought territory, raising the odds of a mean-reversion pause toward the 42.86 200-SMA. The trade-quality score (83.7) and profit-probability (78.0) argue the structure is sound, while the more moderate technical-inflection reading (69.4) suggests waiting for a cleaner entry rather than chasing.
Tuesday Playbook — Top 5 Setups
The day's five highest-conviction setups, ranked by technical inflection, profit-probability, and trade quality — 3 long, 0 short. Trade your plan and manage risk first. Also screened: $VRT, $CVNA, $POET, $CRWV, $HD, $BMNR.
Inflection69
Probability78
Quality84
IBIT is extended 4.33% above its 200-SMA (42.86) and 22% above its 50-SMA (36.63), with an RSI(14) of 81.36 flagging an overbought inflection point where trend strength meets stretched conditions.
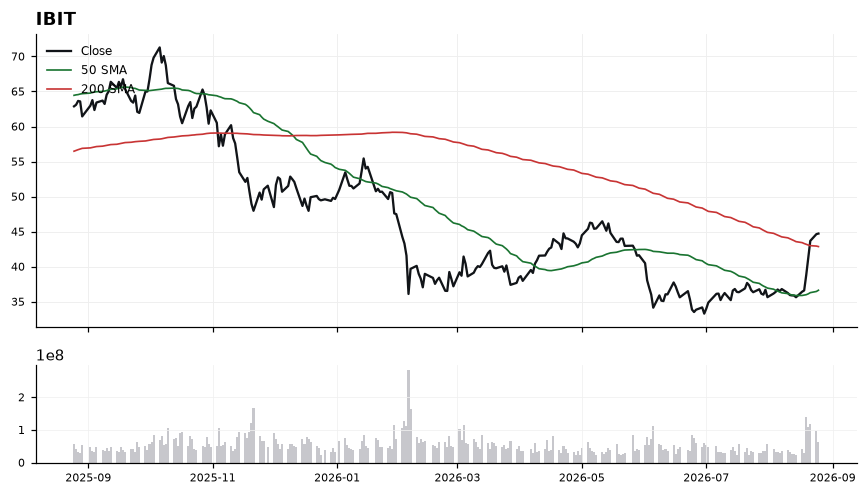
EntryWatch for a pullback into the 42.86–43.50 zone (200-SMA retest) for a lower-risk long trigger; alternatively, only add on a decisive close back above 45.00 that resets RSI without breaking structure.
InvalidationA close below 42.00 would invalidate the setup, signaling loss of the 200-SMA as support and a likely mean-reversion toward the 50-SMA at 36.63.
Targets46.50 as initial upside continuation objective → 48.75 on sustained momentum extension
TimeframeSwing (2–6 weeks)
Inflection67
Probability78
Quality84
GLD is trending firmly above both moving averages, with price at 428.07 stretched 3.38% over the 200-SMA (414.09) and 11.28% above the 50-SMA (384.67). The inflection sits at the intersection of strong momentum (MACD 11.53 > signal 8.16) and an overbought RSI of 73, which historically precedes either a shallow reset or a blow-off continuation.
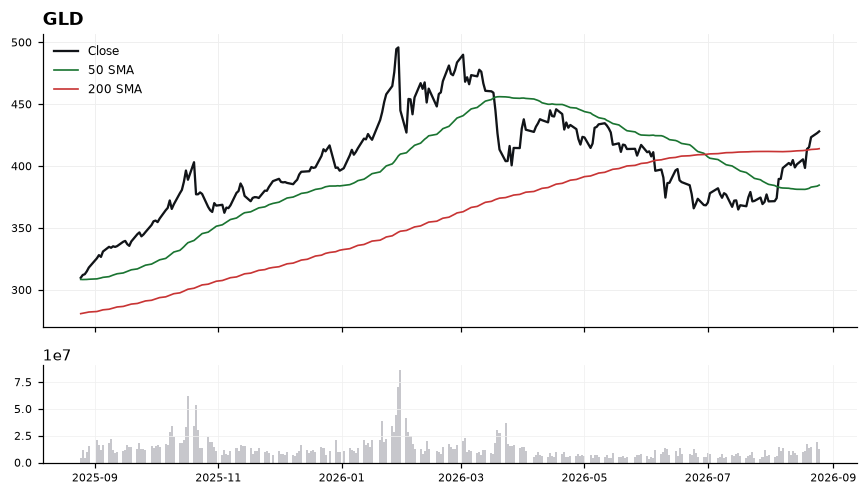
Trend structure is unambiguously constructive: the 50-SMA is well above the 200-SMA and price rides above both, confirming an uptrend. However, RSI at 73.04 signals extended conditions, meaning entries at spot carry elevated pullback risk. MACD remains positive and above its signal, so momentum has not yet cracked — a mean-reversion toward the 50-SMA (~384.67) or at minimum the 200-SMA (~414.09) would be the first sign of trend fatigue, while holding above 414 keeps the bull case intact.
EntryPrefer to wait for a pullback into the 414–418 zone (near the 200-SMA) for a lower-risk long trigger; alternatively, a momentum add on a decisive close back above 430 after any RSI reset below 65.
InvalidationInvalidation on a daily close below 412 (through the 200-SMA at 414.09); losing that level would break the immediate uptrend structure and open a path toward the 50-SMA near 385.
TargetsFirst target 438–442 (measured extension of current leg) → Second target 452–455 on continuation
TimeframeSwing (2-6 weeks)
Inflection64
Probability83
Quality81
COST is compressing directly on top of its 200-day SMA (959.57) with price at 960.01, a classic inflection point where the intermediate trend is being retested against a rising 50-day (947.69). Momentum is quietly turning up — MACD 2.42 has crossed above signal 1.42 while RSI at 52.95 leaves ample room before overbought.
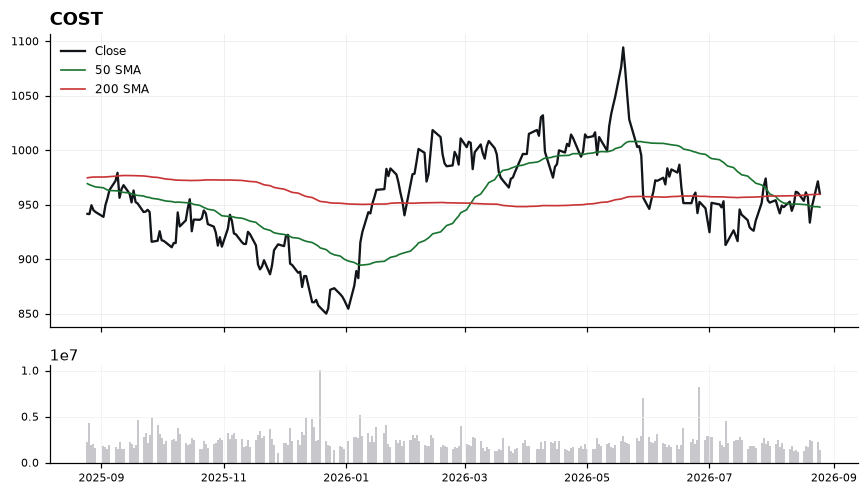
Price sits just 0.05% above the 200-SMA and roughly 1.3% above the 50-SMA, meaning both key trend lines are stacked beneath as tiered support in a bullish alignment. The MACD spread of +1.00 above signal confirms momentum has flipped positive without being extended, and RSI at 52.95 shows the move is still in its early expansion phase. The tape is coiling in a tight band around the 200-day, so a decisive push through will likely define the next multi-week leg. Failure to hold the 947-960 shelf, however, would flip this back into a range fade.
EntryPreferred entry on a confirmed reclaim/hold above 962-965 (breakout over the 200-SMA), or on a controlled pullback into the 950-953 zone that respects the 50-SMA at 947.69.
InvalidationInvalidation on a daily close below 944; that breaks the 50-SMA support, negates the MACD cross, and signals the 200-SMA retest has failed.
TargetsFirst target 978-982 (recovery of prior swing shelf) → Second target 998-1005 (measured extension from the 947/960 base)
TimeframeSwing (2-6 weeks)
Inflection59
Probability83
Quality85
FIG is holding above both its 50-SMA (22.79) and 200-SMA (26.55), with price at 27.27 sitting just 2.72% above the long-term trend line — a classic reclaim-and-retest zone where the working long bias is either confirmed or rejected.
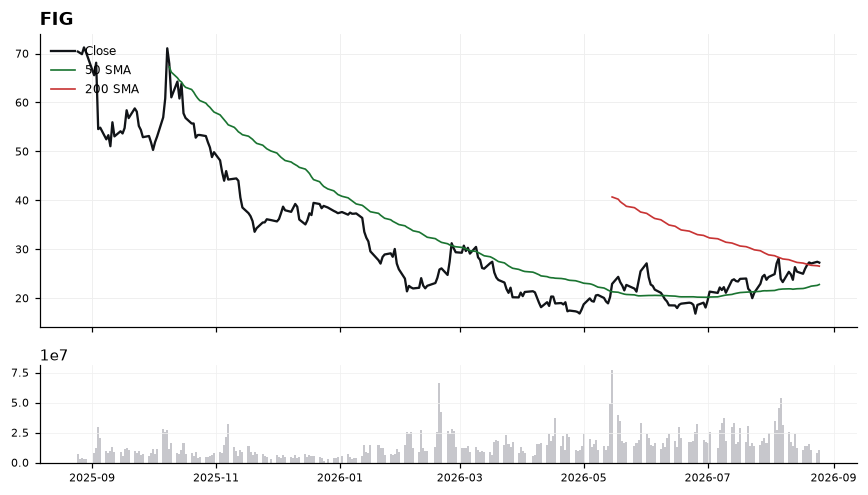
The 50-SMA has crossed well above the 200-SMA, signaling a constructive intermediate trend, and MACD at 1.16 above its 1.05 signal line indicates momentum remains positive but is flattening. RSI at 59.08 sits in the upper-neutral band — enough thrust to extend, but not yet overbought, leaving room to work higher. The tight 2.72% cushion to the 200-SMA means this level (26.55) is the pivotal line-in-the-sand: holding it validates the reclaim, losing it flips the structure back to range-bound.
EntryPreferred accumulation on a controlled pullback into 26.55–26.90 (200-SMA retest); alternative momentum trigger on a decisive close back above 27.50 with MACD holding its cross.
InvalidationInvalidation on a daily close below 26.00, which would break the 200-SMA reclaim and signal the inflection has failed back toward the 50-SMA at 22.79.
Targets29.00 — first measured extension from the 200-SMA reclaim → 31.50 — trend continuation target as MACD momentum expands
TimeframeSwing (2-6 weeks)
Inflection62
Probability83
Quality79
CRM is riding a Hot momentum theme, trading at 205.69 with price now sitting above both the 50-SMA (176.24) and the 200-SMA (200.36), a classic bullish stack that has only recently re-established itself. The 2.66% cushion over the 200-day makes this an inflection zone where either continuation extends the trend or a failed retest reasserts the prior range.
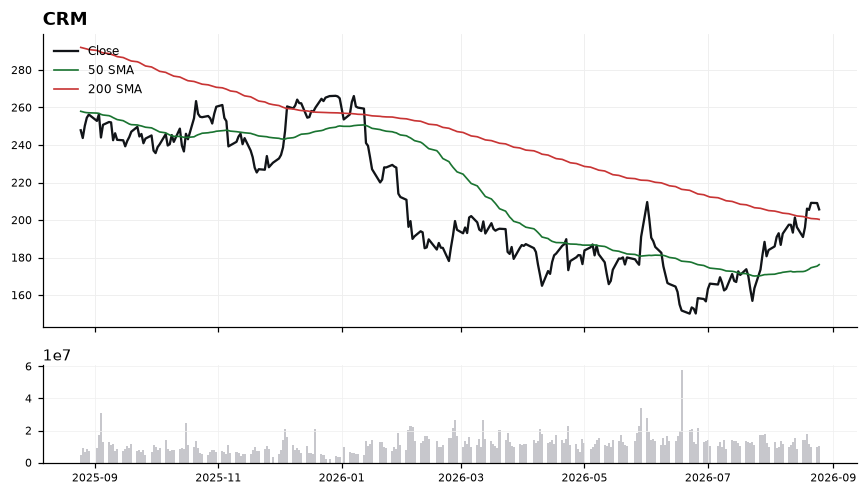
Trend structure is constructive: the 50-SMA at 176.24 sits well below spot and the 200-SMA at 200.36 has flipped into near-term support, framing a higher-low regime. RSI at 62.38 confirms momentum without yet reaching overbought (>70), leaving room for upside continuation. MACD at 8.45 above signal 7.73 is a positive but narrowing spread, hinting momentum is decelerating and any bull thrust needs fresh volume to hold. Net read: bias is long while price defends the 200-SMA, but reaction at 200.36 is the tell.
EntryPreferred add zone on a controlled pullback into 201.50–203.00, close to the 200-SMA retest; alternatively, a momentum trigger on a decisive close above 208.00 opens continuation.
InvalidationInvalidation on a daily close below 198.50 — that breaks back beneath the 200-SMA (200.36) and neutralizes the bullish stack, signaling the inflection failed.
TargetsFirst target 214.00 — recent momentum extension where prior overhead supply is likely to appear → Second target 222.50 — measured continuation objective if RSI pushes toward 70 and MACD spread re-expands
TimeframeSwing (2-6 weeks)
Ranked by technical inflection, profit-probability, and trade quality. Educational only. Not financial advice.