Thursday Playbook — Top 5 Setups

The day's five highest-conviction setups, ranked by technical inflection, profit-probability, and trade quality — 5 long, 0 short. Trade your plan and manage risk first. Also screened: $COST, $POET, $AKAM, $GOOGL, $ASAN, $HD.

1$GLDTradedLongMedium convictionscore 78
Inflection73
Probability78
Quality86

GLD is trading at 415.26, just 0.50% above its rising 200-SMA (413.19) and well above its 50-SMA (382.05), placing price at a decision point where the long-term trend is reasserting itself after a reclaim of the mean.
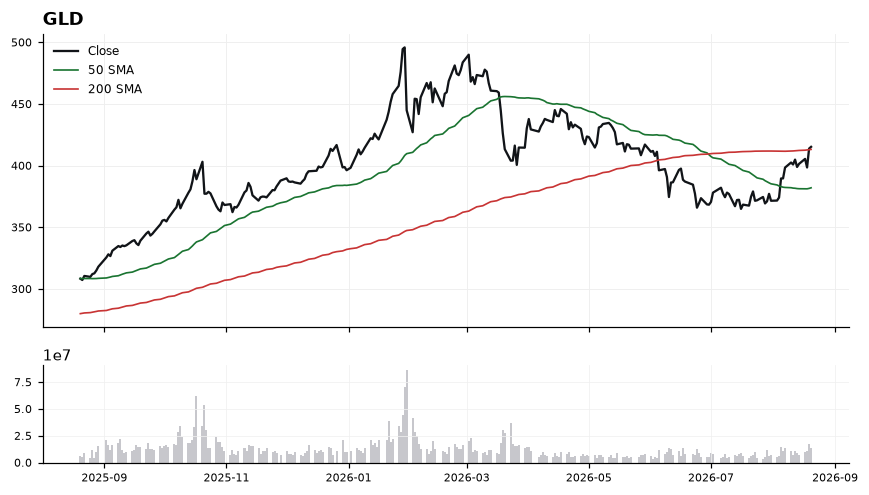
GLD chart with 50 and 200 day moving averages

The 50-SMA at 382.05 sits meaningfully below the 200-SMA at 413.19, and price now hovers just above both — a classic re-engagement of the long-term trend. RSI at 67.62 signals strong momentum without yet breaching the 70 overbought threshold, and MACD at 8.43 over a 5.69 signal line confirms momentum expansion. However, the thin 0.50% cushion over the 200-SMA means the setup is binary: a hold converts resistance into support, while a rejection reopens downside toward the 50-SMA gap.

EntryConsider staged engagement on a hold of the 413-415 shelf (200-SMA reclaim zone), with confirmation on a close above 417; alternatively, a pullback tag of 413.19 that holds intraday offers a tighter-risk trigger.
InvalidationA daily close below 408 would invalidate the reclaim thesis — it would signal the 200-SMA has flipped back to resistance and open a path toward the mid-390s and eventually the 50-SMA at 382.05.
TargetsFirst target 428-430, a measured extension from the 200-SMA reclaim and prior momentum swing → Second target 440-445, where RSI would likely press overbought and trend extension typically pauses
TimeframeSwing (2-6 weeks)
2$FIGTradedLongMedium convictionscore 76
Inflection63
Probability83
Quality85

FIG is trading at 27.31, holding above both its 50-SMA (22.31) and 200-SMA (26.83), with the recent reclaim of the long-term average marking a potential trend-inflection point just 1.80% above the 200-day.

FIG chart with 50 and 200 day moving averages

Price sits 22.4% above the 50-SMA and 1.8% above the 200-SMA, signaling short-term momentum leading a longer-term base recovery. RSI at 59.7 is constructive but not yet overbought, leaving room for continuation before hitting stretched conditions near 70. MACD at 1.06 remains above its signal line at 0.96, confirming positive momentum, though the narrow 0.10 spread suggests the impulse is maturing rather than accelerating. The tight proximity to the 200-SMA makes this level the pivotal line between trend confirmation and failed breakout.

EntryConsider engagement on a controlled pullback into the 26.83–27.00 zone (retest of the 200-SMA) or on a momentum trigger through 27.60 on expanding MACD spread.
InvalidationA close below 26.30 would invalidate the setup, as it would reject the 200-SMA reclaim and shift structure back below the long-term trend line.
TargetsFirst target 29.20, representing a measured extension from the 200-SMA reclaim → Second target 31.00, aligned with prior structural resistance and a fuller momentum expansion
TimeframeSwing (2-6 weeks)
3$CRMHotLongMedium convictionscore 75
Inflection65
Probability83
Quality79

CRM is trading at 205.43, extended above a rising 50-SMA (173.83) and just reclaiming the 200-SMA at 201.08 by 2.16%. The setup is at inflection because a fresh 200-day retake, if it holds, often marks the pivot from downtrend repair into trend continuation.

CRM chart with 50 and 200 day moving averages

Price sits above both key moving averages with the 50-SMA (173.83) well below the 200-SMA (201.08), a configuration that still needs a golden cross to fully confirm regime change. RSI at 64.13 shows strong momentum without being overbought, leaving room before the 70 threshold. MACD at 7.87 over its 7.01 signal keeps the momentum spread positive but narrowing, so follow-through is needed to prevent a bearish cross. Net read: constructive but early — the 201.08 line is the pivot that must hold.

EntryPreferred entry on a controlled pullback into 201–203 (200-SMA retest zone); alternative momentum trigger on a daily close above 208.
InvalidationClose below 198.50, which would forfeit the 200-SMA reclaim and invalidate the long thesis by signaling a failed breakout back into the prior range.
Targets215 (initial measured move from the 200-SMA reclaim) → 225 (extension target if momentum expands)
TimeframeSwing (2-6 weeks)
4$CAVATradedLongMedium convictionscore 74
Inflection62
Probability83
Quality80

CAVA is coiling right at its 50-SMA (72.39) with price at 72.03, just 1.33% above the rising 200-SMA (71.09) — a classic inflection where a reclaim of the 50-day would flip the short-term trend back with the intermediate trend.

CAVA chart with 50 and 200 day moving averages

Momentum is quietly turning constructive: RSI at 55.89 sits above the neutral 50 line but not yet overbought, and MACD at 0.34 has crossed decisively above its signal at -0.94, indicating a fresh positive momentum shift. Structurally, price is sandwiched between the 50-SMA (72.39) overhead and the 200-SMA (71.09) below, framing a tight decision zone. Technical-inflection scores 61.6 with trade-quality 80.1 and profit-probability 83.0, corroborating a working long bias contingent on reclaiming the 50-day.

EntryTrigger long on a confirmed reclaim of the 50-SMA at 72.40, ideally on a close above 72.50; alternative pullback entry into the 71.10-71.40 zone near the 200-SMA
InvalidationDaily close below 70.50 invalidates the setup, as it would break the 200-SMA support and negate the MACD-driven momentum thesis
TargetsFirst target 74.75 (recent range resistance, ~3.8% above entry) → Second target 77.50 (measured extension from the 50/200-SMA base)
TimeframeSwing (2-6 weeks)
5$VRTAI InfrastructureLongMedium convictionscore 72
Inflection56
Probability83
Quality85

VRT is trading at 264.63, wedged between reclaimed long-term support at the 200-SMA (252.82) and overhead resistance at the 50-SMA (294.27). With RSI at 43 and MACD (-5.19) crossing above its signal (-6.00), the tape is transitioning from downside momentum to a potential base-building phase — a classic inflection for an AI Infrastructure long.

VRT chart with 50 and 200 day moving averages

Price sits just 4.67% above the 200-SMA, which has flipped from resistance to a rising demand shelf and now anchors the risk framework. The 50-SMA at 294.27 slopes above price, confirming the intermediate downtrend is not yet broken and defining the upside gap that must be closed for a full trend repair. MACD's bullish cross beneath zero is an early-stage signal — constructive but not confirmed — while RSI at 43 leaves ample room to run before overbought conditions cap upside. Net-net: the setup is a mean-reversion long toward the 50-SMA, contingent on the 200-SMA holding.

EntryAccumulate on strength above 268 with confirmation, or on pullbacks into the 258-262 zone where price tags the rising 200-SMA support shelf.
InvalidationDaily close below 250 invalidates the thesis — it would breach the 200-SMA (252.82), negate the MACD cross, and signal the trend has resumed lower rather than inflected.
TargetsFirst target 288-294, the underside of the 50-SMA where sellers are likely to re-engage → Second target 305-310, a decisive reclaim of the 50-SMA that would confirm trend repair
TimeframeSwing (2-6 weeks)

Ranked by technical inflection, profit-probability, and trade quality. Educational only. Not financial advice.