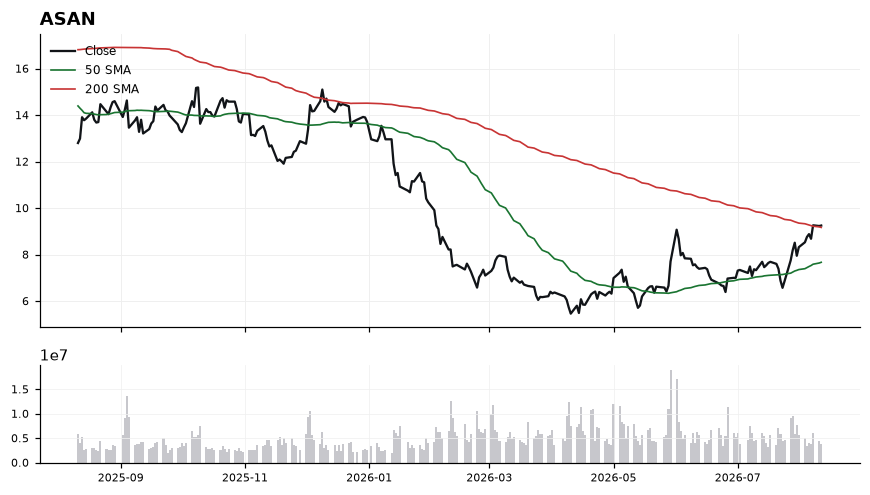
Price at 9.25 sits just above both key moving averages, with the 50-SMA (7.67) tracking sharply below the 200-SMA (9.17) — an early bullish crossover setup rather than a confirmed one. Momentum backs the move: RSI(14) at 66.87 is strong but not yet extended past 70, and MACD at 0.50 above its 0.36 signal line shows expanding positive momentum. The tight distance to the 200-SMA means the tape must hold this line to validate the regime change; failure quickly flips the read back to range.
Tuesday Playbook — Top 5 Setups
The day's five highest-conviction setups, ranked by technical inflection, profit-probability, and trade quality — 5 long, 0 short. Trade your plan and manage risk first. Also screened: $GOOGL, $FSLR, $NOW, $SPY, $DPZ, $COST.
ASAN is reclaiming its 200-day SMA (9.17) after basing well above a rising 50-day SMA (7.67), placing price at a classic trend-reset inflection with only 0.89% of separation to defend.
HD is trading at 354.48, above both its 50-SMA (335.92) and 200-SMA (347.76), with the shorter average recently reclaiming and pulling toward the longer trend line — a classic inflection where a trending posture is being retested against overhead moving-average confluence.

Price sits just 1.93% above the 200-SMA, a thin cushion that keeps the setup binary: hold above and the reclaimed trend resumes, lose it and the bias flips. RSI at 59.45 is constructively bullish without being overbought, leaving room to extend, while MACD at 4.42 above its 9.45… signal at 2.74 confirms positive momentum has widened. The 50-SMA at 335.92 below the 200-SMA at 347.76 still reflects a prior downtrend structure, so the current push is best treated as a trend-repair attempt that needs to hold the 347–348 shelf to validate.
RKLB is coiling just above its rising 200-SMA (78.15) while still trading below a declining 50-SMA (87.92), creating a classic inflection between trend support and overhead mean-reversion resistance. With price at 80.01 and only 2.38% above the long-term trend line, the tape is at a decision point where reclaim attempts and breakdown risks are both live.

RSI(14) at 53.15 is neutral-constructive, showing momentum has stabilized without yet confirming trend acceleration. MACD at -2.11 versus signal -5.10 shows a bullish crossover in progress from oversold territory, suggesting downside momentum is fading. However, price sits ~9% below the 50-SMA at 87.92, which caps the near-term rally path, while the 200-SMA at 78.15 defines the line in the sand for the working long bias. The narrow 2.38% cushion to the 200-SMA means the setup is technically constructive but structurally fragile.
ALGN is coiling between its 50-SMA (174.71) resistance and 200-SMA (168.14) support, sitting just 2.86% above the long-term trend. With RSI at 48.76 and MACD (-0.63) curling above its signal (-0.69), the tape is at a genuine inflection where the next directional break defines the swing.

Price at 172.96 is pinned below the 50-SMA at 174.71, which has capped recent upside, while the rising 200-SMA at 168.14 has served as the structural floor. RSI near the midline (48.76) reflects balanced momentum, and the MACD histogram turning positive (-0.63 vs -0.69) hints at nascent bullish momentum without confirmation. Trade-quality (84.7) and profit-probability (83.0) scores are constructive, but the inflection score of 57.9 signals the setup still needs a trigger. A decisive reclaim of the 50-SMA would flip the short-term regime; failure keeps it range-bound.
HIMS is coiling between its rising 200-SMA (29.56) and flattening 50-SMA (31.66), with price at 30.51 sitting just 3.22% above longer-term trend support. The setup is at an inflection because MACD (-0.42) has crossed above its signal (-0.53) while RSI (48.3) curls up from neutral, hinting at a momentum turn but not yet confirmation.

Price is trading below the 50-SMA (31.66) but holding a constructive 3.22% cushion over the 200-SMA (29.56), keeping the broader uptrend structurally intact. The MACD histogram has flipped positive (-0.42 vs -0.53 signal), an early momentum stabilization that typically precedes trend re-engagement. RSI at 48.34 is mid-range, leaving room to run before overbought conditions and consistent with a base-building phase. The technical-inflection score of 56.9 alongside a strong trade-quality read (84.5) frames this as a higher-quality setup awaiting a trigger through the 50-SMA.
Ranked by technical inflection, profit-probability, and trade quality. Educational only. Not financial advice.