Monday Playbook — Top 5 Setups

The day's five highest-conviction setups, ranked by technical inflection, profit-probability, and trade quality — 4 long, 0 short. Trade your plan and manage risk first. Also screened: $AVGO, $SPY, $GOOGL, $HIMS, $RH, $AMZN.

1$CAVATradedLongMedium convictionscore 79
Inflection70
Probability83
Quality87

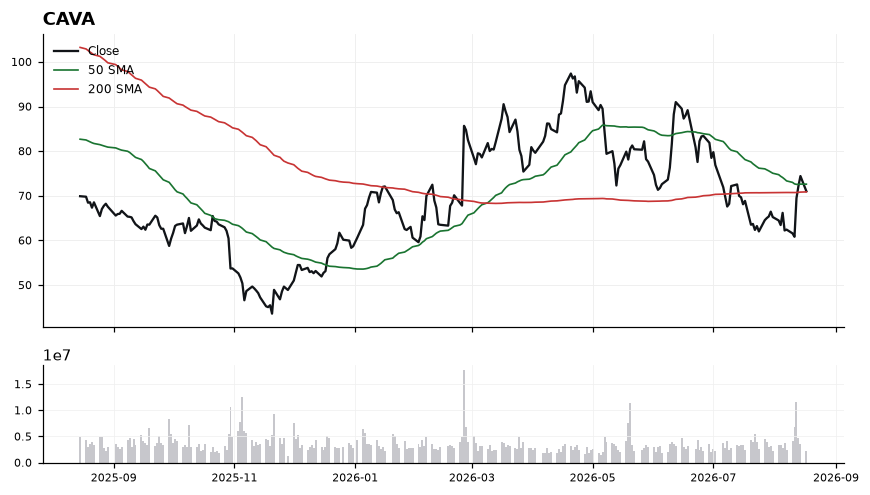
CAVA is coiled directly on its 200-day SMA (70.87) with price at 71.02, just 0.22% above the line and 1.58 points below the 50-day SMA at 72.60 — a classic inflection where the long-term trend line either reasserts as support or gives way.

CAVA chart with 50 and 200 day moving averages

RSI at 54.99 sits in neutral-to-constructive territory, showing momentum has recovered without stretching. MACD at -0.35 versus signal -1.91 is a meaningful bullish crossover expansion, indicating downside momentum has faded and is turning up. However, the 50-SMA (72.60) still sits above spot, so the tape remains technically capped until reclaimed. Holding the 200-SMA (70.87) while MACD widens above signal is the constructive tell supporting the long bias.

EntryPreferred accumulation zone 70.90–71.20 on continued holds of the 200-SMA; confirmation add on a decisive close back above the 50-SMA at 72.60.
InvalidationInvalidation on a sustained close below 69.75 (roughly 1.5% under the 200-SMA), which would signal the long-term trend line has failed and the MACD recovery is stalling.
TargetsFirst target 74.00, reclaiming space above the 50-SMA → Second target 76.50 on trend continuation and MACD crossing above zero
TimeframeSwing (2-6 weeks)
2$IONQTradedLongMedium convictionscore 77
Inflection57
Probability98
Quality79

IONQ at 46.84 sits just above both its 50-SMA (45.73) and 200-SMA (45.20), with the shorter average crossing over the longer — a classic long-bias inflection where trend structure is turning constructive but price remains within striking distance of mean-reversion levels.

IONQ chart with 50 and 200 day moving averages

Price is 3.63% above the 200-SMA, a modest cushion that keeps the tape close to its longer-term equilibrium rather than extended. RSI at 60.28 signals firm momentum without breaching overbought territory, leaving room to run before exhaustion. MACD at 0.70 versus a signal of -0.85 marks a decisive bullish crossover, confirming the shift from downside to upside momentum. Together, the stack (price > 50-SMA > 200-SMA) frames a technically improving setup, though the trade-quality score of 78.6 and inflection score of 56.7 suggest confirmation, not a breakout yet.

EntryPreferred accumulation zone on a pullback into 45.73–46.20 (50-SMA retest); alternative momentum trigger on a sustained close above 47.20.
InvalidationInvalidation on a close below 45.00, which would break the 200-SMA and negate the bullish trend-alignment and MACD signal.
TargetsFirst target 49.50, prior swing resistance and ~9.5% above the 200-SMA → Second target 52.00, extension objective if momentum sustains above 50
TimeframeSwing (2-6 weeks)
3$ALGNTradedLongMedium convictionscore 76
Inflection65
Probability83
Quality86

ALGN is coiling between its rising 200-SMA (168.96) and downsloping 50-SMA (175.44), setting up an inflection as MACD (-0.02 vs -0.33) curls higher while price sits just 1.30% above long-term trend support.

ALGN chart with 50 and 200 day moving averages

Price at 171.16 is sandwiched inside a tight 6-point band, with the 200-SMA acting as the line-in-the-sand for the longer-term uptrend and the 50-SMA capping rallies. RSI at 46.75 is neutral but building from below-50, consistent with the MACD histogram compression that typically precedes a directional resolution. The narrowing MACD spread suggests downside momentum is exhausting, though a decisive close back over the 50-SMA is still required to confirm bulls have reclaimed control. Until then, the setup is a mean-reversion long against 200-SMA support, not a breakout.

EntryScale zone 169.50-171.50 near current price and the 200-SMA shelf; add-on trigger on a reclaim of the 50-SMA at 175.44 with MACD crossing above zero.
InvalidationDaily close below 167.00 — this breaks the 200-SMA (168.96) with buffer and invalidates the long-term uptrend structure, flipping the working bias to neutral/short.
Targets175.44 at the 50-SMA (first resistance and add-on trigger) → 181.00-183.00 measured move on a 50-SMA reclaim
TimeframeSwing (2-6 weeks)
4$RKLBTradedLongMedium convictionscore 72
Inflection55
Probability83
Quality84

RKLB is coiling between its 50-SMA at 84.78 and 200-SMA at 78.48, with price at 82.08 sitting just 4.59% above the long-term trend line. The MACD (-0.17) has ripped well above its signal (-2.50), signaling momentum inflection while RSI at 55.36 leaves room to run before overbought.

RKLB chart with 50 and 200 day moving averages

Price is trading below the 50-SMA (84.78) but firmly above the rising 200-SMA (78.48), a classic mid-range compression setup. The wide MACD-vs-signal spread of +2.33 points to accelerating upside momentum from a washed-out base, while RSI at 55.36 confirms buyers are back in control without stretching the tape. The 50-SMA at 84.78 is the immediate ceiling; a reclaim there would flip the intermediate trend and open the path back to prior highs. Failure to clear it would leave 78.48 as the line separating a working long from a broken structure.

EntryPreferred zone 80.50-82.50 on constructive basing; add-on trigger on a decisive close above the 50-SMA at 84.78.
InvalidationCloses below 78.48 (200-SMA); losing this level negates the working long bias and signals a shift to a lower-trend regime.
TargetsFirst target 84.78 (50-SMA reclaim) → Second target 89.50-90.00 on trend continuation above the 50-SMA
TimeframeSwing (2-6 weeks)
5$HDTradedWatchMedium convictionscore 72
Inflection60
Probability75
Quality85

HD is coiling right at its 50-SMA (338.25) while trading 2.59% below the 200-SMA (346.86), setting up a classic mean-reversion decision point where the next directional resolution defines the swing bias.

HD chart with 50 and 200 day moving averages

Price at 337.88 is effectively pinned to the 50-SMA (338.25), with the 200-SMA (346.86) acting as the dominant overhead ceiling. RSI at 47.13 is neutral-to-soft, and MACD at 1.75 sitting below its signal at 2.67 confirms fading upside momentum in the short term. Trade-quality scores well (84.9) and inflection is elevated (60.0), but momentum has not yet turned — this is a watch-and-react setup, not a chase.

EntryTier 1 trigger: reclaim and hold above 340 with MACD crossing back above signal, targeting a run at the 200-SMA. Tier 2 (preferred R/R): pullback into 332–334 support zone with stabilizing RSI back above 45.
InvalidationInvalidation on a daily close below 330. Losing that shelf breaks the 50-SMA structure and signals momentum rolling toward a deeper retrace, negating the mean-reversion thesis.
TargetsFirst target: 346.50, just under the 200-SMA where sellers likely reappear → Second target: 353.00, a decisive reclaim of the 200-SMA opening trend repair
TimeframeSwing (2-6 weeks)

Ranked by technical inflection, profit-probability, and trade quality. Educational only. Not financial advice.

Monday Playbook — Top 5 Setups — Daily Playbook