Price at 349.39 sits above both the 50-SMA (346.97) and 200-SMA (336.96), confirming a stacked bullish structure. RSI at 55.15 is constructive but not overbought, leaving room for expansion, and MACD at -2.47 crossing above its signal at -3.04 flags an early momentum inflection off a reset. The narrow gap between spot and the 50-SMA means this zone is the decisive pivot — hold it and trend resumes; lose it and the structure weakens toward the 200-SMA.
Tuesday Playbook — Top 5 Setups
The day's five highest-conviction setups, ranked by technical inflection, profit-probability, and trade quality — 5 long, 0 short. Trade your plan and manage risk first. Also screened: $MSTR, $AMAT, $SPY, $SHOP, $LRCX, $COST.
Inflection58
Probability98
Quality91
GOOGL is coiling just above its 50-SMA (346.97) while holding a 3.69% cushion over the rising 200-SMA (336.96), setting up a classic trend-continuation inflection within the MAG7 long bias.
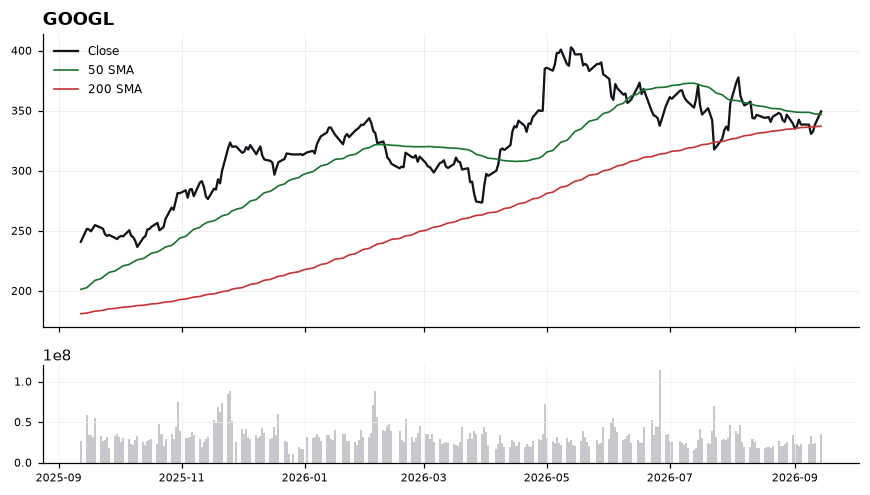
EntryAccumulate on pullbacks into the 347.00–349.50 shelf near the 50-SMA, or add on a decisive reclaim of 352.00 with momentum follow-through.
InvalidationA close below 342.50 invalidates the setup — it would break the 50-SMA cleanly and open a retest of the 200-SMA at 336.96, negating the bullish stack.
Targets360.00 as the first measured extension where prior supply typically re-emerges → 372.00 as the trend-continuation objective if MACD momentum expands above zero
TimeframeSwing (2-6 weeks)
Inflection75
Probability64
Quality86
TXRH is testing its 200-SMA (180.06) from above with price at 181.12, sitting just 0.59% above long-term trend support while RSI(14) at 28.49 flags a deeply oversold condition — a classic inflection zone where trend either reasserts or breaks.
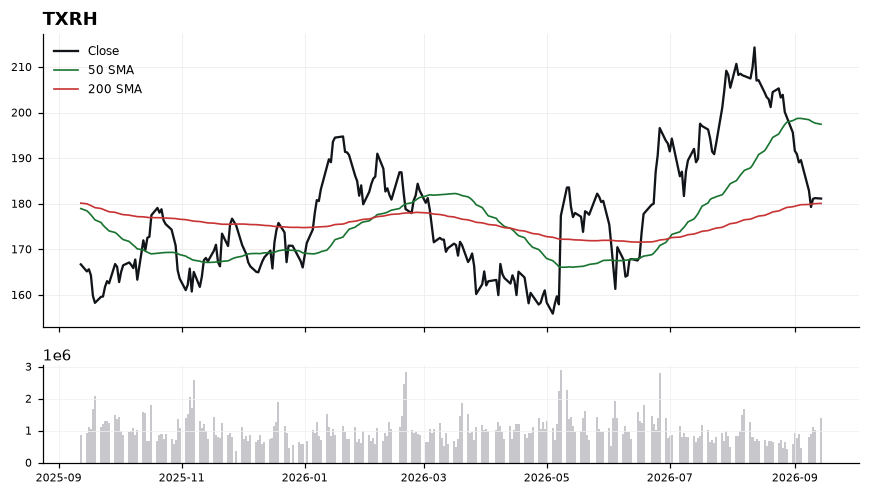
Price has broken below the 50-SMA (197.42) and is now compressed against the 200-SMA (180.06), which historically acts as a decision line for trend continuation. RSI at 28.49 is in oversold territory, suggesting downside momentum is stretched, but MACD at -5.44 versus signal -3.35 confirms bearish momentum has not yet turned. The setup pairs a stretched oscillator with unresolved momentum, meaning the reaction off the 200-SMA is the tell — either a mean-reversion bounce toward the 50-SMA, or a decisive breakdown below trend.
EntryStagger entries in the 180.00-182.00 zone on evidence of stabilization above the 200-SMA; a confirmation add can be considered on a reclaim of 185 with MACD histogram narrowing.
InvalidationDaily close below 176.50 invalidates the long thesis, as it would confirm a decisive loss of the 200-SMA (180.06) and open the door to a broader trend change.
TargetsFirst target 190.00 — prior consolidation shelf and mid-point back toward the 50-SMA → Second target 197.00 — retest of the 50-SMA (197.42) as overhead resistance
TimeframeSwing (2-6 weeks)
Inflection73
Probability69
Quality80
COIN is testing a critical inflection at the 200-day SMA (190.96) with price at 191.45, just 0.26% above this long-term trend divider. Reclaiming this level while the 50-SMA (165.57) trends higher sets up a potential regime shift from downtrend to uptrend.
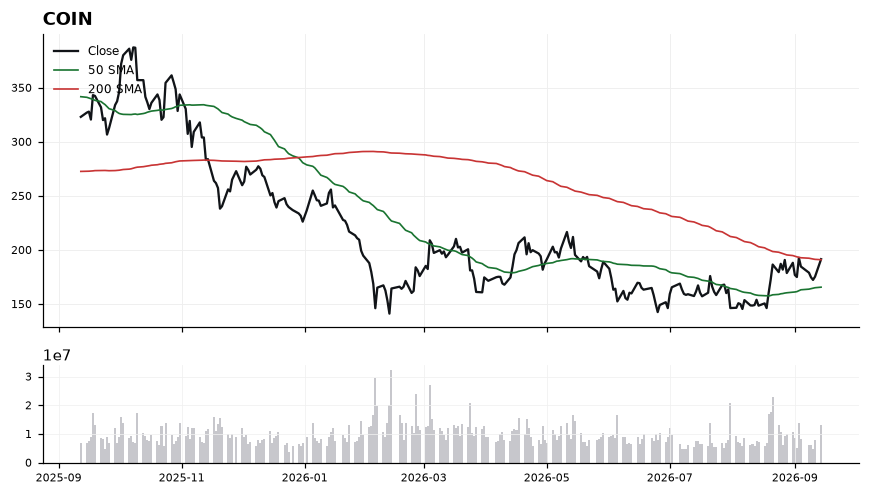
Price is straddling the 200-SMA (190.96) with the 50-SMA (165.57) rising ~15% below, confirming shorter-term momentum has already turned constructive. RSI at 59.06 is firmly bullish but not yet overbought, leaving room to extend. However, MACD at 5.26 has slipped just below its signal at 5.54, hinting at short-term momentum cooling even as the broader structure improves. The tension between a bullish trend reclaim and softening MACD is precisely what makes this an inflection rather than a confirmed breakout.
EntryPreferred entry on a confirmed hold above 190.96 (200-SMA), ideally on a pullback into the 188-191 zone; aggressive add on a daily close above 195 with MACD re-crossing higher.
InvalidationInvalidation on a daily close below 184. Breaking that level would reject the 200-SMA reclaim, signal the MACD bearish cross is leading price, and return COIN to a range-bound posture below trend.
TargetsFirst target 208-212, prior supply cluster and measured move from the 50-SMA base → Second target 225, extension objective if momentum re-accelerates
TimeframeSwing (2-6 weeks)
Inflection47
Probability98
Quality80
QCOM trades at 180.15, extended 7.12% above its 200-SMA (168.18) and 6.8% above its 50-SMA (168.68), with momentum accelerating as MACD (3.04) sits well above signal (0.82). The setup is at an inflection because price is pressing higher into a mid-60s RSI regime, testing whether trend continuation absorbs the extension or invites a mean-reversion pause.
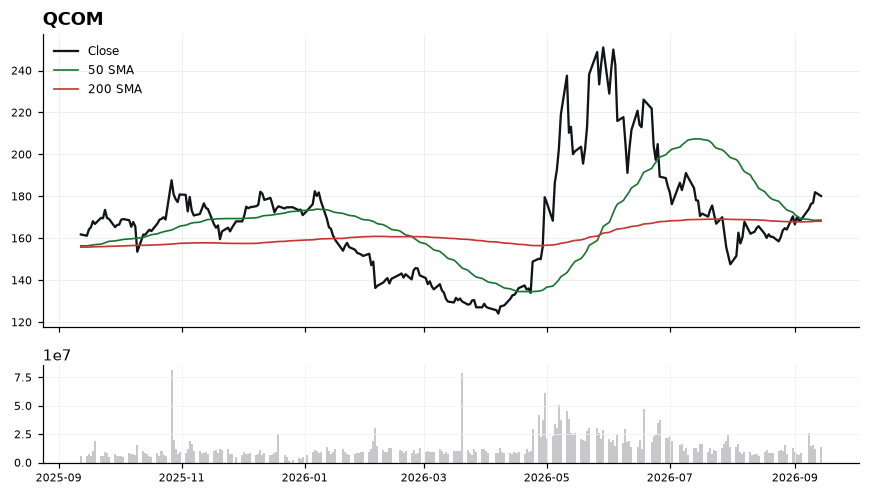
The 50-SMA has crossed above the 200-SMA and the two are tightly stacked near 168, forming a converged trend base that reinforces the longer-term bias. RSI at 63.33 confirms strength without being overbought, while the MACD spread of +2.22 signals momentum is still expanding rather than rolling over. However, a 7.12% gap above the 200-SMA suggests entries are best on pullbacks toward the rising 50-SMA rather than chasing the current print.
EntryPreferred accumulation zone 172.00-175.00 on a controlled pullback toward the 50-SMA; alternative momentum trigger on a decisive close above 182.00 with follow-through.
InvalidationDaily close below 167.50 invalidates the thesis, as it would break both the 50-SMA (168.68) and 200-SMA (168.18) simultaneously and negate the bullish trend structure.
Targets185.00 as an initial measured extension of current momentum → 192.00 as a secondary objective if MACD momentum persists and RSI holds above 60
TimeframeSwing (2-6 weeks)
Inflection53
Probability78
Quality89
META trades at 665.60, extended 6.75% above its 200-SMA (623.49) and 10.5% above its 50-SMA (602.56), aligning with a Long bias but flashing near-term overbought signals. The setup sits at an inflection where trend strength must justify a stretched tape.
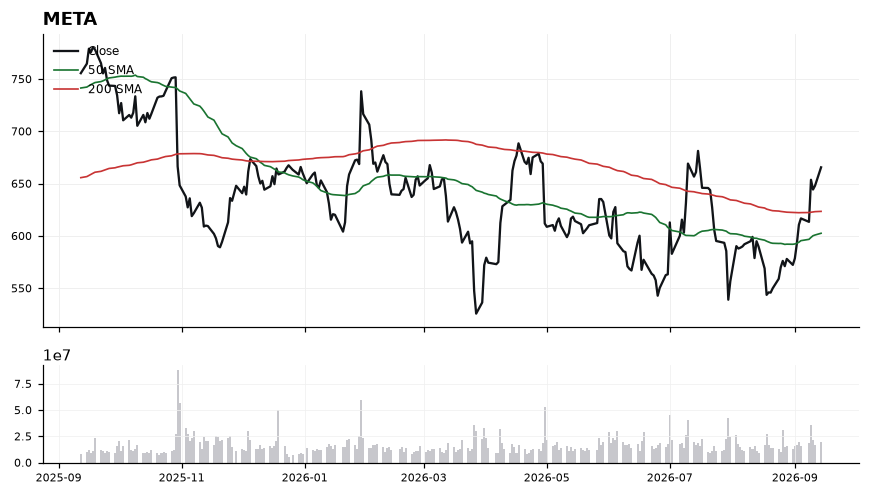
Price is in a confirmed uptrend with the 50-SMA (602.56) above the 200-SMA (623.49) and holding well over both. MACD at 17.16 versus signal 6.74 shows a wide, expanding positive spread, corroborating momentum. However, RSI(14) at 70.77 is in overbought territory, indicating the move is stretched and prone to mean-reversion or consolidation. Trade-quality (89.1) and profit-probability (78.0) are strong, but a middling inflection score (53.3) argues for disciplined entries rather than chasing.
EntryPreferred entry on pullback into 645–655; aggressive add-on trigger above 670 on a daily close confirming continuation.
InvalidationDaily close below 620, which would breach the 200-SMA (623.49) zone and invalidate the trend-continuation thesis.
TargetsFirst target 690 (measured extension from the 50-SMA base) → Second target 715 on sustained momentum continuation
TimeframeSwing (2-6 weeks)
Ranked by technical inflection, profit-probability, and trade quality. Educational only. Not financial advice.