The 50-SMA sits materially below price at 36.28, confirming the medium-term uptrend, while the 200-SMA at 43.00 has flipped from resistance to nearby support. MACD's positive spread of 0.72 above signal validates trend acceleration, but RSI at 79.54 is deep in overbought territory, historically consistent with pullbacks or consolidation. The narrow 1.59% cushion to the 200-SMA means any mean reversion tests that line quickly, making it the pivotal level for the working bias. Trade-quality (85.6) and profit-probability (78.0) scores are constructive, but the overbought RSI supports a Watch stance rather than chase.
$IBIT
WatchTechnical snapshot
as of Aug 21, 2026Chart
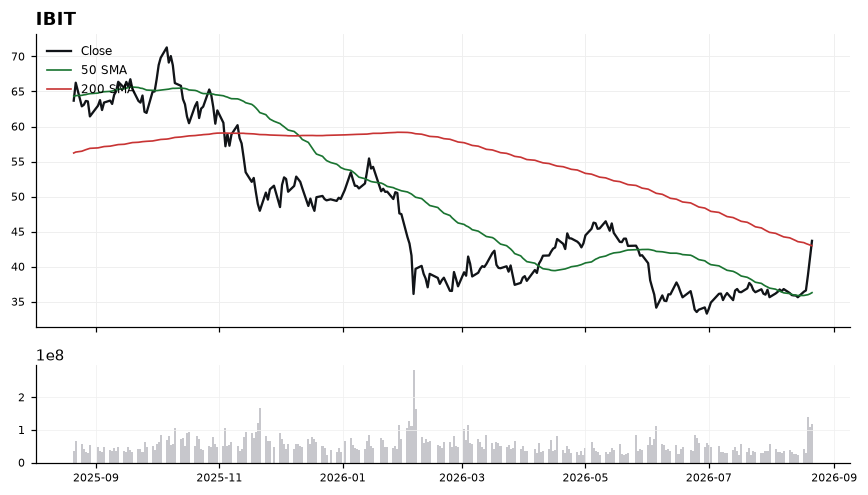
Daily close with 50/200-day SMA and volume · Aug 21, 2026
Latest read
From the Aug 23, 2026 Playbook →Compare IBIT with
All Traded →IBIT — frequently asked
- Is IBIT above its 200-day moving average?
- Yes — $IBIT is trading 1.60% above its 200-day moving average (around 43.00), which reflects a long-term uptrend. (Educational only, not financial advice.)
- Is IBIT overbought or oversold?
- IBIT's 14-day RSI is 80, which is overbought. RSI above 70 is overbought, below 30 is oversold, and in between is neutral. (Educational only, not financial advice.)
- What is IBIT's RSI?
- IBIT's current 14-day RSI is 80 (overbought). (Educational only, not financial advice.)
- Is IBIT in an uptrend or a downtrend?
- IBIT's 50-day moving average (36.28) is below its 200-day (43.00), a bearish (death-cross) structure. (Educational only, not financial advice.)
- What is the latest read on IBIT?
- Our most recent Daily Playbook reads IBIT as Watch (#1 · Watch · 43.68). (Educational only, not financial advice.)
Get IBIT signals the moment they fire
Daily Playbook reads, real-time technical alerts, and human-vetted AI analysis across the market's leaders.
Educational only. Not financial advice. Technicals are end-of-day and may lag live prices.