Price action is decisively above the 50-SMA at 36.76 and the 200-SMA at 42.80, defining an uptrend structure. However, RSI(14) at 79.33 is in overbought territory, historically a zone where near-term pullbacks or consolidations become probable. The MACD spread of nearly 1.0 above signal confirms strong momentum, but the narrow 3.88% cushion over the 200-SMA means any sharp reversal quickly retests trend support. Net read: trend is intact and constructive, but chasing at current extension carries poor risk/reward without a pullback.
Wednesday Playbook — Top 5 Setups
The day's five highest-conviction setups, ranked by technical inflection, profit-probability, and trade quality — 4 long, 0 short. Trade your plan and manage risk first. Also screened: $HIMS, $POET, $GOOGL, $NVDA, $AKAM, $CRWV.
Inflection70
Probability78
Quality84
IBIT trades at 44.46, extended above both the 50-SMA (36.76) and reclaimed 200-SMA (42.80), sitting only 3.88% above the long-term mean. The setup is at an inflection because momentum is stretched (RSI 79.3) while MACD confirms trend expansion (1.94 vs signal 0.96), creating a tension between breakout continuation and mean-reversion risk.
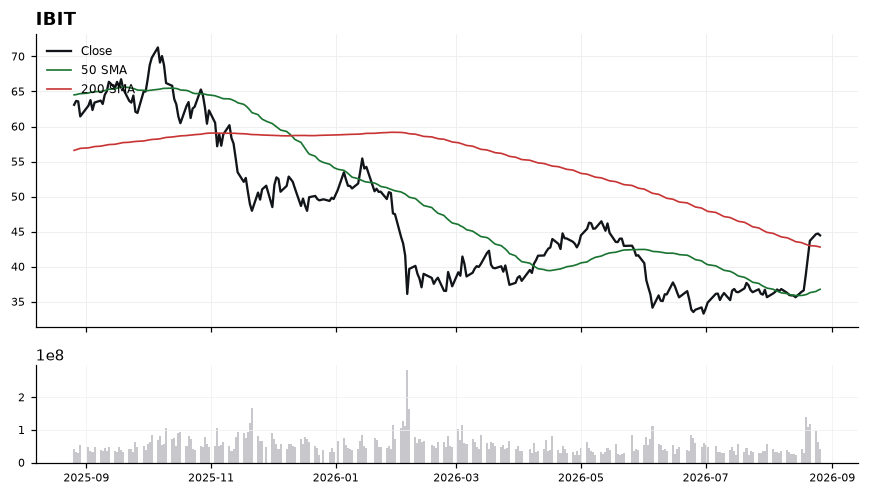
EntryPrefer to watch for a pullback into the 42.80-43.50 zone (200-SMA retest) for a lower-risk entry; alternatively, a decisive close above 45.00 on sustained momentum can serve as a continuation trigger.
InvalidationInvalidation on a daily close below 41.80; breaking that level would forfeit the 200-SMA reclaim and signal the breakout has failed back into the prior range.
TargetsFirst target 47.50 (measured continuation from current breakout leg) → Second target 50.00 (round-number psychological objective and next momentum extension)
TimeframeSwing (2-6 weeks)
Inflection68
Probability78
Quality86
GLD is extending a trend leg with price at 421.32, holding above both the 50-SMA (385.16) and 200-SMA (414.37), and the recent reclaim of the 200-day places the tape at a momentum inflection where continuation and mean-reversion pull compete.
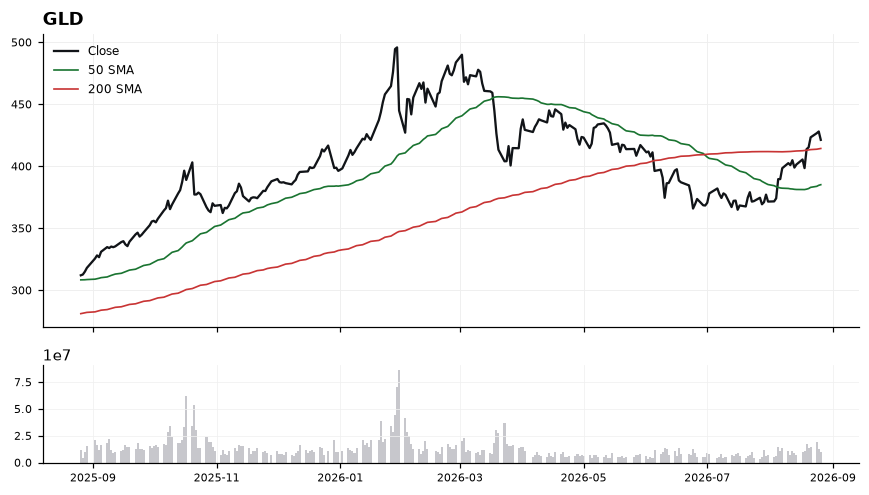
Structure is constructive: price sits only 1.68% above the 200-SMA yet a full ~9.4% above the 50-SMA, indicating a strong medium-term thrust that is stretched versus its intermediate anchor. MACD at 11.52 over signal 8.83 confirms positive momentum with widening spread, while RSI at 66.02 is firm but not yet overbought, leaving room before exhaustion. The bull case remains intact so long as the 200-SMA (414.37) is defended on pullbacks; loss of it would flip the near-term read to distribution back toward the 50-SMA.
EntryPreferred pullback entry into the 415–417 zone near the 200-SMA (414.37); breakout add-on only on a decisive close above 424.
InvalidationDaily close below 412 invalidates the setup — it would break the 200-SMA reclaim, neutralize MACD, and signal the trend leg has failed.
TargetsFirst target 430 (recent momentum extension objective above spot) → Second target 440 (measured continuation of the move off the 50-SMA)
TimeframeSwing (2-6 weeks)
Inflection60
Probability83
Quality86
CVNA trades at 73.95, holding just above both its 200-SMA (72.69) and reclaimed 50-SMA (67.75), placing it at a classic trend-transition inflection where a stacked-moving-average base is forming.
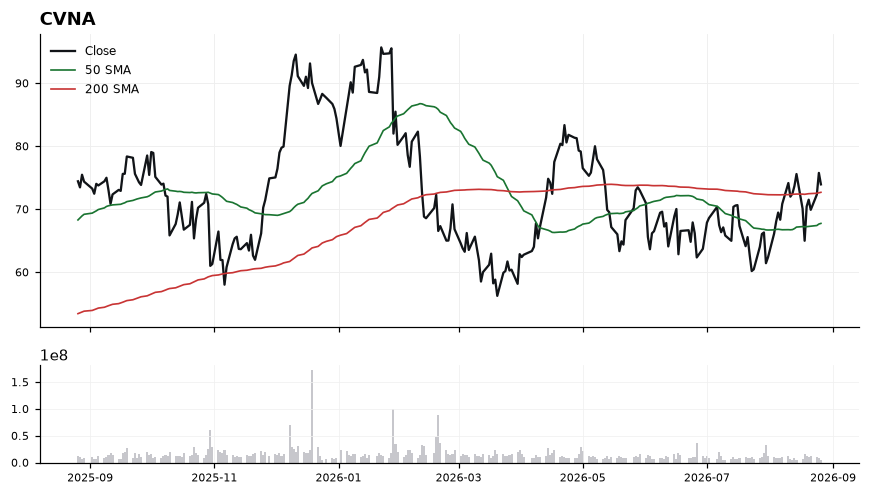
Price sits only 1.74% above the 200-SMA, meaning the long-term trend line is now acting as immediate support rather than resistance. The 50-SMA at 67.75 has curled below spot, creating a bullish alignment (50 < price, 200 < price) that typically accompanies trend continuation. RSI at 56.16 shows constructive momentum without being overbought, leaving room to extend, while MACD at 1.64 over its 1.31 signal line confirms positive momentum crossover. The trade-quality score of 85.5 and profit-probability of 83.0 reinforce that the technical structure is favorable, though the 60.4 inflection score signals the move still needs confirmation.
EntryPreferred entry on a pullback into the 72.70–73.20 zone (retest of the 200-SMA), or on a momentum trigger above 74.50 confirming rejection of the 200-SMA as support.
InvalidationInvalidation on a daily close below 71.80; breaking back beneath the 200-SMA (72.69) would negate the reclaim thesis and put price back into the 50-to-200 SMA no-man's-land.
TargetsFirst target 78.50, a measured extension from the 50/200-SMA base → Second target 82.00, projecting continuation of the MACD-confirmed momentum leg
TimeframeSwing (2-6 weeks)
Inflection60
Probability83
Quality85
FIG is trading at 27.03, extended above a rising 50-SMA (22.96) and now working through the 200-SMA (26.45) from below — a classic reclaim attempt that defines the near-term inflection.
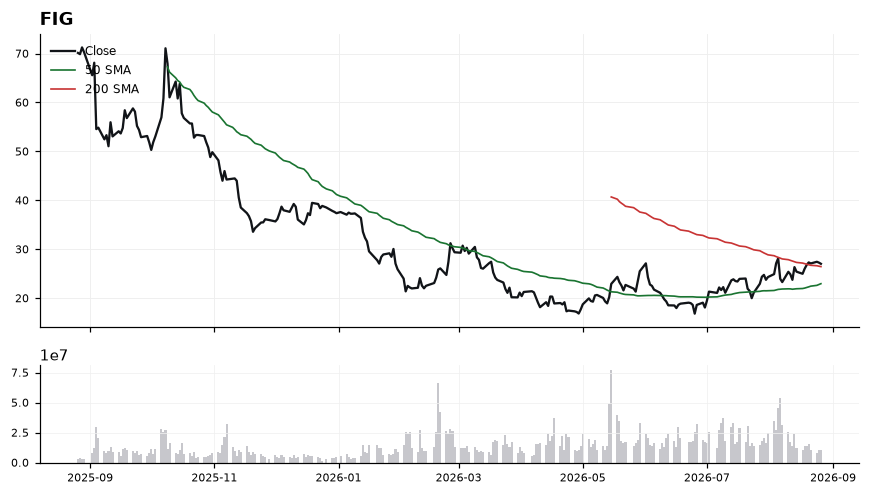
Price sits just 2.18% above the 200-SMA, so the 26.45 line is the pivotal fulcrum for the bias. Trend structure is constructive: 50-SMA well below spot and MACD (1.13) still above signal (1.07), though the narrow spread hints momentum is decelerating. RSI at 57.95 is bullish but not overbought, leaving room to extend if 26.45 holds as support on retests. A trade-quality read of 85.2 and profit-probability of 83.0 support the long working bias, while the 60.1 inflection score argues for disciplined entry rather than chasing.
EntryPreferred entry on a pullback into 26.45–26.80 (200-SMA retest) or a momentum trigger on a daily close back above 27.25 after any dip.
InvalidationDaily close below 25.90 invalidates the reclaim — it would put price back under the 200-SMA and signal the breakout attempt has failed.
TargetsFirst target 29.20 (measured extension from the 50/200-SMA gap) → Second target 31.50 on continuation and MACD re-expansion
TimeframeSwing (2-6 weeks)
Inflection61
Probability83
Quality79
CRM is in a confirmed uptrend with the 50-SMA (177.06) tracking above the 200-SMA (200.19) and price at 205.62 hovering just 2.71% above the long-term line — a classic post-reclaim consolidation where the 200-SMA becomes the pivot for the next leg.
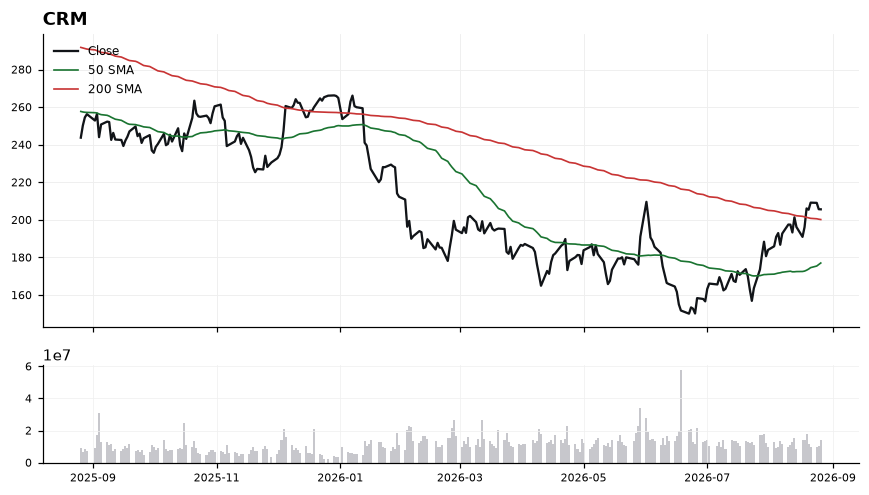
RSI at 62.30 shows firm momentum without breaching overbought, leaving room to extend. MACD at 8.23 remains above its signal at 7.83, but the narrow 0.40 spread signals momentum is decelerating and needs a fresh impulse. Price sits above both moving averages, with the 200-SMA at 200.19 acting as the first line of defense and the 50-SMA at 177.06 as the structural floor. The 2.71% cushion to the 200-SMA is thin enough that any slip re-tests that level quickly.
EntryPreferred accumulation zone 201.00–203.50 on a pullback that holds the 200-SMA (200.19); alternatively, a momentum trigger on a decisive close above 208.00 confirming continuation.
InvalidationDaily close below 197.50 invalidates the setup, as it would break the 200-SMA and flip the reclaimed level into resistance, negating the long bias.
Targets212.50 — near-term resistance and prior swing extension → 220.00 — measured move objective on trend continuation
TimeframeSwing (2-6 weeks)
Ranked by technical inflection, profit-probability, and trade quality. Educational only. Not financial advice.