Momentum is constructive but stretched: RSI(14) at 66.99 is approaching overbought, while MACD at 2.20 remains above its signal at 1.70, confirming the uptrend's slope. The 50-SMA at 37.40 has curled well below price, and the reclaim of the 200-SMA at 42.51 is the pivotal structural event — that level now defines the bull/bear demarcation. With price only ~1.25 points above the 200-SMA, the setup favors buying strength on controlled dips rather than chasing, given the elevated RSI reading.
Wednesday Playbook — Top 5 Setups
The day's five highest-conviction setups, ranked by technical inflection, profit-probability, and trade quality — 4 long, 1 short. Trade your plan and manage risk first. Also screened: $FIG, $AMZN, $GLW, $COST, $HIMS, $CRCL.
Inflection64
Probability78
Quality85
IBIT is trading at 43.76, extended above both its 50-SMA (37.40) and 200-SMA (42.51), with the price sitting just 2.93% above the long-term trend line — a classic post-reclaim inflection where trend continuation must be re-confirmed from a shallow pullback.
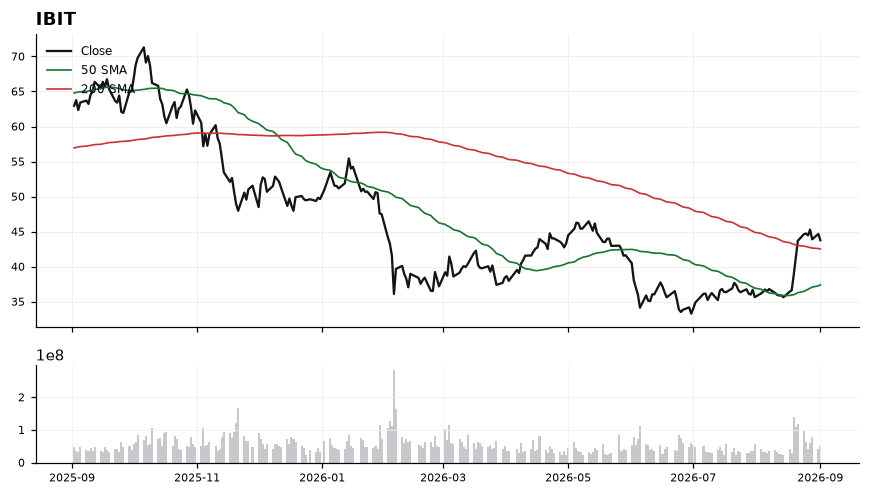
EntryPreferred accumulation zone 42.80–43.20 on a pullback that holds the 200-SMA (42.51); breakout add-on trigger above 44.20 on expanding momentum.
InvalidationDaily close below 42.10 invalidates the thesis — it would signal a failed 200-SMA reclaim and shift structure back below the long-term mean, negating the long bias.
TargetsFirst target 46.00 (measured move from the 200-SMA reclaim) → Second target 48.50 (trend extension objective if momentum holds)
TimeframeSwing (2-6 weeks)
Inflection67
Probability69
Quality91
AVGO is pinned to its 200-day SMA (369.55) with price at 369.68, a textbook inflection where a multi-month trend line is being retested after a pullback from above the 50-day. With trade-quality scoring 90.6 and technical-inflection at 66.7, the reaction off this line is likely to define the next swing.
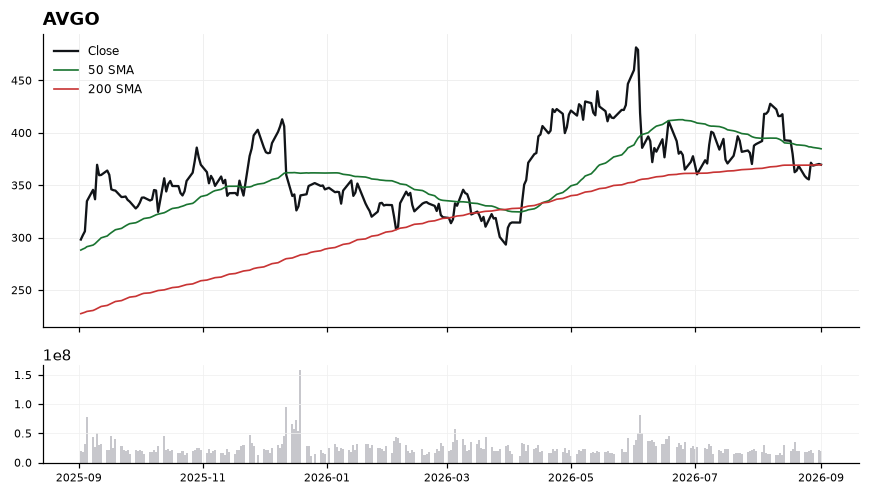
Price sits just 0.04% above the 200-SMA (369.55) but 3.9% below the 50-SMA (384.84), signaling short-term weakness inside a still-intact longer trend. RSI at 43.33 is soft but not oversold, leaving room for either a bounce or a flush. MACD at -8.08 remains below its signal (-6.41) and has not yet crossed, so momentum is still negative and confirmation is pending. The confluence of the 200-SMA acting as support and RSI stabilizing above 40 is the pivot to watch.
EntryPrefer a reclaim trigger: staged entries on a hold and close back above 372, adding on strength through 378. Aggressive tactical entry can be scaled between 368-370 while the 200-SMA (369.55) holds intraday.
InvalidationDaily close below 362 invalidates the 200-SMA support thesis and opens the door to a broader trend break, shifting bias to neutral/defensive.
TargetsFirst target 384-385 at the 50-SMA, where prior supply and mean-reversion resistance align → Second target 396-400 on a MACD bullish cross and RSI push back above 55
TimeframeSwing (2-6 weeks)
Inflection68
Probability69
Quality88
VRT is testing its 200-day SMA at 255.88 with price at 255.97 — a textbook inflection where a long-term trend line either holds and reasserts or breaks and flips to resistance. With the working long bias, this is the decision point.
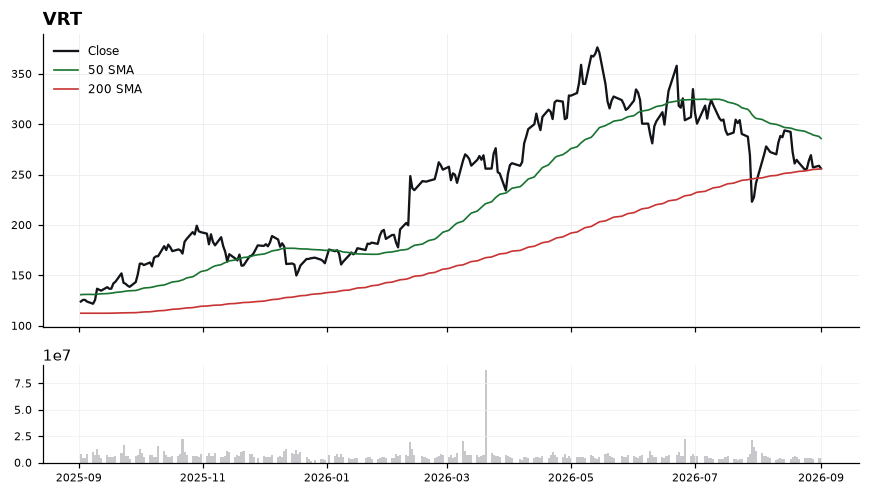
Price sits just 0.04% from the 200-SMA (255.88) but remains below the 50-SMA at 285.78, signaling a medium-term downtrend testing long-term support. RSI at 41.89 is weak but not oversold, leaving room for a bounce without a stretched setup. MACD at -7.28 below its signal at -6.88 confirms momentum is still negative, so any long here is a counter-trend bet on the 200-SMA holding rather than a confirmed reversal.
EntryStagger entries on a defended reclaim of the 200-SMA: initial tranche 255-258 on intraday hold, add-on above 262 with RSI crossing back over 50. Avoid chasing without MACD narrowing toward its signal.
InvalidationHard invalidation on a daily close below 250 (roughly 2.3% under the 200-SMA), which would confirm the long-term trend line has flipped to resistance and negate the long thesis.
TargetsFirst target 275 — prior consolidation shelf and gap-fill zone below the 50-SMA → Second target 285-288 — direct test of the 50-SMA at 285.78 where trend re-alignment would be confirmed
TimeframeSwing (2-6 weeks)
Inflection68
Probability61
Quality94
GOOGL is pinned to its 200-SMA at 335.05 with price at 335.02, creating a binary inflection where the working short bias hinges on whether this long-term mean holds as resistance or breaks as support. Momentum is soft but not oversold, giving the setup room to resolve directionally.
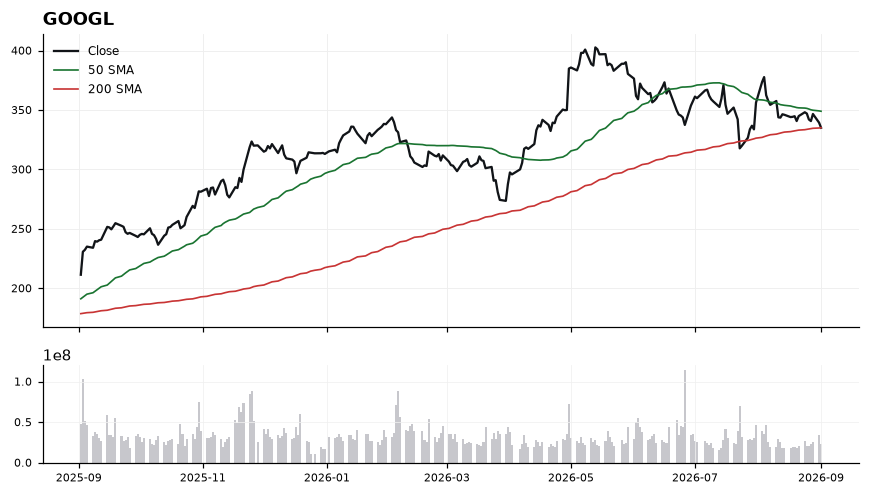
Price sits -0.01% from the 200-SMA and roughly 4% below the 50-SMA at 348.91, confirming a shorter-term downtrend pressing into a longer-term pivot. RSI at 41.25 reflects fading momentum without capitulation, leaving downside slack before oversold. MACD at -2.92 below its signal at -2.20 shows the histogram still expanding negatively, consistent with sellers in control. Failure to reclaim the 50-SMA keeps the tape vulnerable to a break of the 335 shelf.
EntryConsider short exposure on a rejection between 335 and 340, or on a confirmed breakdown close below 334; avoid chasing directly at the 200-SMA line.
InvalidationInvalidation on a daily close above 349 (reclaim of the 50-SMA), which would neutralize the short thesis and signal a momentum reset back toward the prior range highs.
TargetsFirst target 325 (measured move below the 200-SMA) → Second target 315 (extension zone if momentum accelerates)
TimeframeSwing (2-6 weeks)
Inflection55
Probability83
Quality84
BMNR is trading at 23.37, holding above both its 50-SMA (17.82) and 200-SMA (22.45), with the working long bias supported by a fresh MACD positive spread and a constructive but not-yet-overbought RSI. The inflection sits right on the 200-day reclaim zone, where a decisive hold separates trend continuation from a failed breakout.
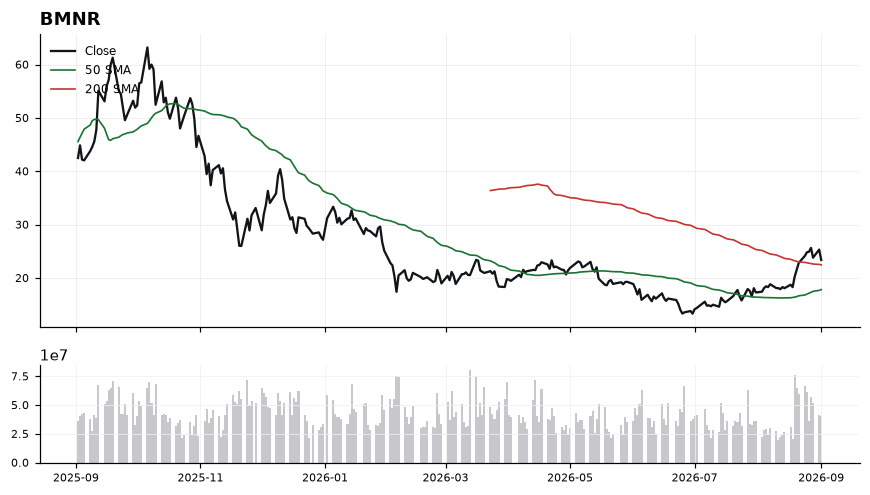
Price is only 4.08% above the 200-SMA at 22.45, making that level the pivotal line between a confirmed regime shift and a false break. The 50-SMA at 17.82 sits well below spot, evidencing strong intermediate momentum, while MACD at 2.00 over signal 1.70 confirms an active positive cross. RSI at 60.42 shows momentum leadership without exhaustion, leaving room to extend before hitting overbought territory near 70. Trade-quality (83.9) and profit-probability (83.0) scores are firm, though technical-inflection (55.2) flags that follow-through still needs to prove itself above the 200-day.
EntryConsider staged entries on a controlled pullback into 22.60–23.00 (retest of the 200-SMA shelf), or on a momentum trigger via a daily close above 23.80 reclaiming recent highs.
InvalidationInvalidation on a daily close below 22.00 — this would forfeit the 200-SMA reclaim, neutralize the MACD signal, and shift bias back toward the 50-SMA zone near 17.82.
TargetsFirst target 25.50 — measured extension from the 200-SMA breakout → Second target 27.80 — trend continuation objective if RSI pushes toward 70
TimeframeSwing (2-6 weeks)
Ranked by technical inflection, profit-probability, and trade quality. Educational only. Not financial advice.