Price sits only 1.92% above the reclaimed 200-SMA at 414.64, keeping the long-term trend structurally intact while the 50-SMA at 385.66 sits ~9% below, evidencing strong medium-term momentum. RSI at 66.68 approaches the 70 threshold, suggesting upside is stretched but not yet exhausted, while a positive MACD spread of ~2.12 keeps momentum bias to the upside. The technical-inflection score of 67.3 alongside a trade-quality score of 85.3 reflects a high-grade trend with a near-term risk of mean-reversion toward the 200-SMA.
Thursday Playbook — Top 5 Setups
The day's five highest-conviction setups, ranked by technical inflection, profit-probability, and trade quality — 4 long, 0 short. Trade your plan and manage risk first. Also screened: $COST, $AKAM, $AMZN, $POET, $CRWV, $AAPL.
Inflection67
Probability78
Quality85
GLD trades at 422.60, extended above both the 50-SMA (385.66) and 200-SMA (414.64), with MACD (11.48) above its signal (9.36) confirming an uptrend that is now testing overbought conditions as RSI prints 66.68 — an inflection where trend continuation meets a potential pullback.
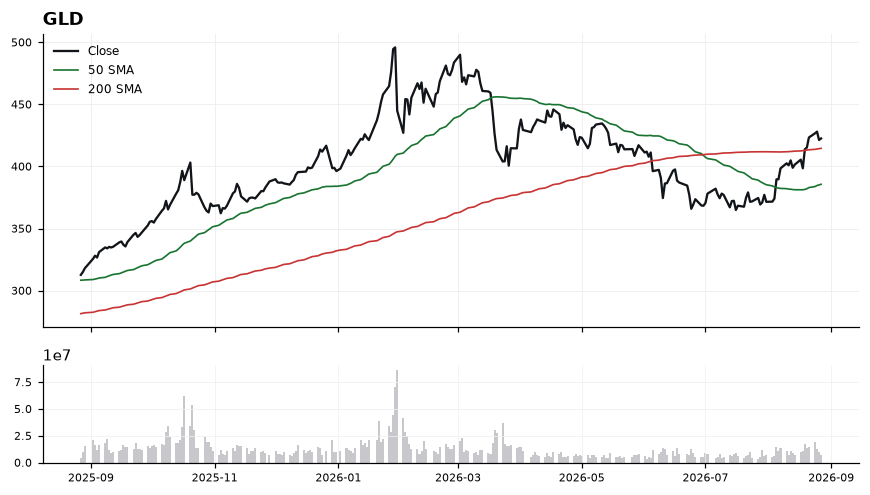
EntryPreferred accumulation zone on a pullback into 414.64–418.00 (200-SMA retest). Momentum add-on trigger only on a decisive close above 425.00 with MACD spread expanding.
InvalidationInvalidation on a daily close below 412.00 — this breaks the 200-SMA reclaim and would flip the working long bias, exposing a deeper mean-reversion toward the 50-SMA at 385.66.
TargetsFirst target: 430.00 — measured continuation of current momentum leg → Second target: 438.00 — trend-extension objective if RSI holds above 60 on any pullback
TimeframeSwing (2-6 weeks)
Inflection60
Probability83
Quality85
CVNA at 74.09 is threading a bullish stack, trading above both the 50-SMA (67.83) and the reclaimed 200-SMA (72.76). The tape sits at an inflection: only 1.83% above the long-term mean with MACD (1.71 vs 1.39) and RSI (56.35) confirming momentum without overheating.
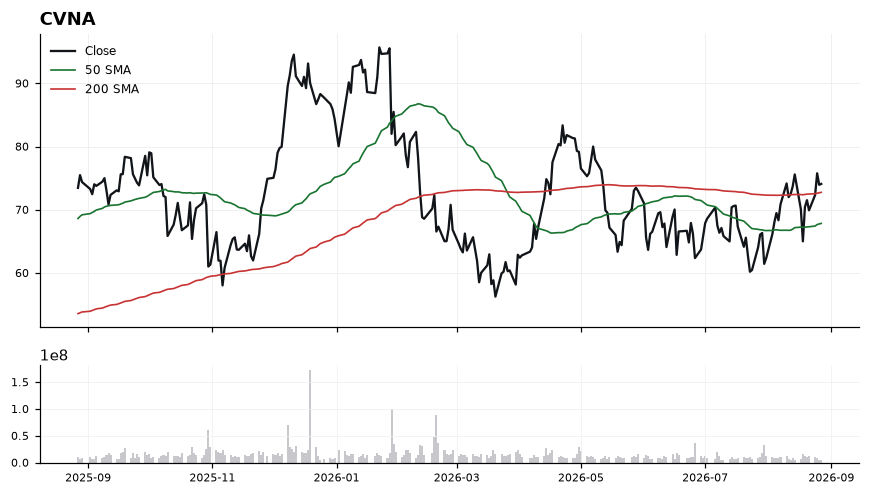
Price recently crossed back above the 200-SMA at 72.76, which is now the pivotal line-in-the-sand for the intermediate trend. The 50-SMA at 67.83 sits below the 200-SMA, meaning the golden-cross structure has not yet completed, keeping this a 'prove-it' reclaim rather than a confirmed uptrend. RSI at 56.35 leaves ample room before overbought, and MACD above signal with a positive spread of 0.32 supports continuation. However, the shallow 1.83% cushion to the 200-SMA means any rejection here would quickly retest that mean.
EntryPreferred accumulation on a controlled pullback into the 72.76-73.50 zone (retest of the 200-SMA); alternatively, momentum add on a decisive close above 75.50 to confirm the breakout hold.
InvalidationDaily close below 71.00. Losing this level negates the 200-SMA reclaim and opens a mean-reversion path toward the 50-SMA at 67.83.
TargetsFirst target 78.50 (measured extension from the 200-SMA reclaim) → Second target 82.50 (prior swing supply / momentum objective)
TimeframeSwing (2-6 weeks)
Inflection63
Probability78
Quality83
IBIT is extended above both moving averages (50-SMA 36.93, 200-SMA 42.73) with price at 45.29, sitting 5.99% above its 200-day — a Watch-bias inflection where trend strength meets overbought conditions.
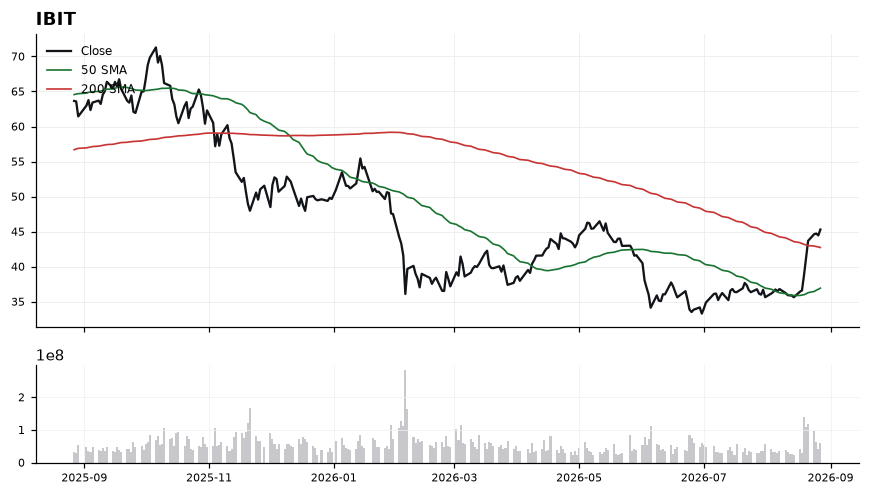
Momentum is strong but stretched: RSI(14) at 80.96 is deep in overbought territory, while MACD at 2.16 vs signal 1.20 confirms an active bullish crossover with widening spread. Price trades above a rising 50-SMA (36.93) which sits below the 200-SMA (42.73) — a structural repair still in progress despite the recent thrust. The 42.73 level (200-SMA) is the pivotal reclaim zone, and the 5.99% distance suggests mean-reversion risk is elevated near-term.
EntryPrefer a pullback trigger toward the 42.70–43.50 zone (retest of the 200-SMA) rather than chasing 45.29; alternatively, a consolidation base above 44.00 with RSI cooling below 70 would offer a cleaner continuation setup.
InvalidationInvalidation on a daily close below 42.00, which would break the 200-SMA reclaim and signal the extension move has failed back into the prior range.
TargetsFirst target 47.50 (measured continuation of current impulse) → Second target 50.00 (round-number extension and momentum objective)
TimeframeSwing (2-6 weeks)
Inflection64
Probability69
Quality90
AVGO is coiling just above its 200-SMA (369.33) at 371.54, sitting only 0.60% above long-term trend support while trading below its 50-SMA (386.59) — a classic inflection where the long-term uptrend is being retested from above.
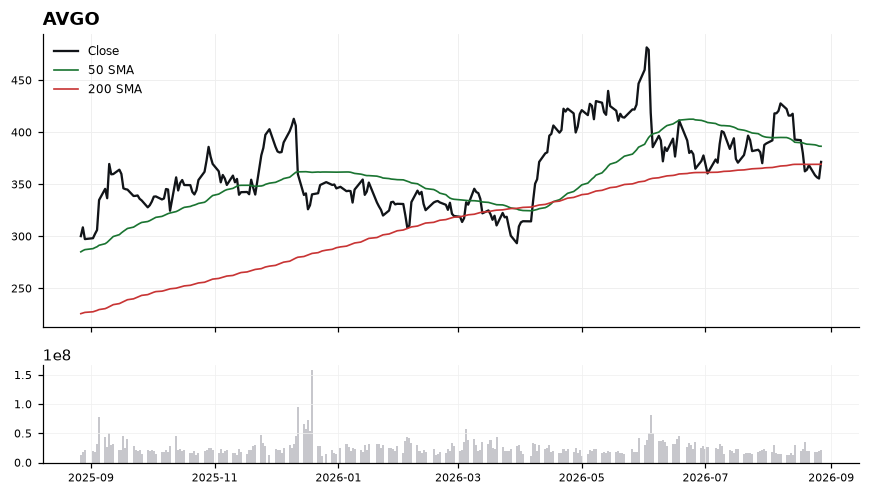
Price is compressed between rising long-term support at 369.33 and near-term resistance at the 50-SMA (386.59), a roughly 4% band that defines the decision zone. RSI at 43.89 is neutral-to-soft but not oversold, leaving room for either a bounce or further drift, while MACD at -9.00 below its signal (-4.53) confirms momentum has not yet turned. The 0.60% cushion to the 200-SMA is thin, so this level must hold to preserve the constructive structure. Trade-quality (90.2) and profit-probability (69.0) scores support the long bias, but confirmation is needed before momentum aligns.
EntryStaged accumulation in the 369.50-372.50 zone on stabilization above the 200-SMA, with a momentum add-on trigger over 378 (reclaim toward 50-SMA); avoid chasing into the 386 resistance.
InvalidationDaily close below 362 invalidates the setup — it would mark a decisive loss of the 200-SMA (369.33) and flip the long-term trend context from support-hold to breakdown.
Targets386.59 — 50-SMA reversion and first supply zone → 398-402 — extension above the 50-SMA reclaim and prior consolidation shelf
TimeframeSwing (2-6 weeks)
Inflection60
Probability69
Quality92
GOOGL sits in a coiled position between reclaimed trend support and lost short-term momentum, with price at 340.65 hovering just 1.90% above the rising 200-SMA (334.29) but below the 50-SMA (350.12). The working long bias is at an inflection because RSI at 44.24 and a MACD (-2.31) beneath its signal (-1.92) show fading downside momentum near a structural support shelf.
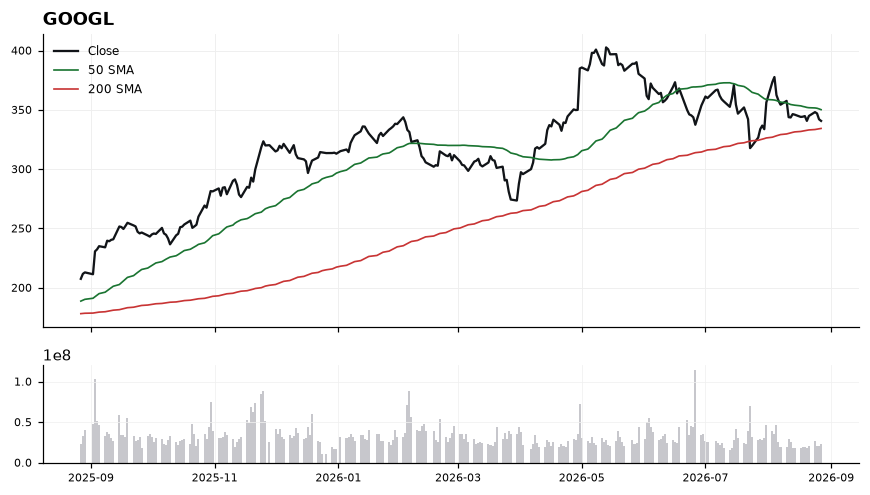
Price is caught in a narrow band where the 200-SMA at 334.29 defines the primary line-in-the-sand and the 50-SMA at 350.12 caps immediate upside, framing a ~4.6% range. RSI at 44.24 is neutral-soft, leaving room to rally without any overbought constraint, while the negative MACD spread of roughly -0.39 signals the trend has not yet turned but is compressing. A trade-quality score of 92.3 and profit-probability of 69.0 argue the risk/reward geometry is attractive so long as the 200-SMA holds. The tell will be whether buyers defend the 334-337 zone and force a reclaim of the 50-SMA to confirm the inflection.
EntryPreferred accumulation zone 336.00-340.65 on stabilization near the 200-SMA; confirmation add on a reclaim and hourly close back above the 50-SMA at 350.12.
InvalidationDaily close below 332.00 (under the 200-SMA at 334.29) invalidates the long thesis, signaling loss of the primary trend support and a likely transition to a lower regime.
TargetsFirst target 350.12 at the 50-SMA, where prior supply is likely to cap the initial move → Second target 358.50-362.00, extension above the 50-SMA if momentum flips MACD positive
TimeframeSwing (2-6 weeks)
Ranked by technical inflection, profit-probability, and trade quality. Educational only. Not financial advice.