Price is pinched in a tight 1.5-point band between the 50-SMA at 169.31 (immediate overhead) and the 200-SMA at 167.83 (immediate support), a classic decision node. MACD at -0.17 versus signal -1.76 shows a decisive bullish crossover with the histogram expanding, confirming momentum has flipped in favor of buyers. RSI at 53.08 is constructive but not stretched, leaving room for continuation without overbought risk. The thin 0.54% cushion to the 200-SMA means the setup is binary: reclaim the 50-SMA and trend resumes; lose the 200-SMA and the bull thesis fails.
Sunday Playbook — Top 5 Setups
The day's five highest-conviction setups, ranked by technical inflection, profit-probability, and trade quality — 4 long, 0 short. Trade your plan and manage risk first. Also screened: $IBIT, $GLD, $AMZN, $META, $SPY, $SOXL.
Inflection67
Probability83
Quality85
QCOM is coiling at an inflection zone with price (168.74) sandwiched between the 50-SMA (169.31) resistance and 200-SMA (167.83) support, sitting just 0.54% above its long-term trend. A rising MACD (-0.17 vs signal -1.76) alongside a neutral RSI of 53 signals momentum is turning up from a reset, with trade-quality scored 84.6.
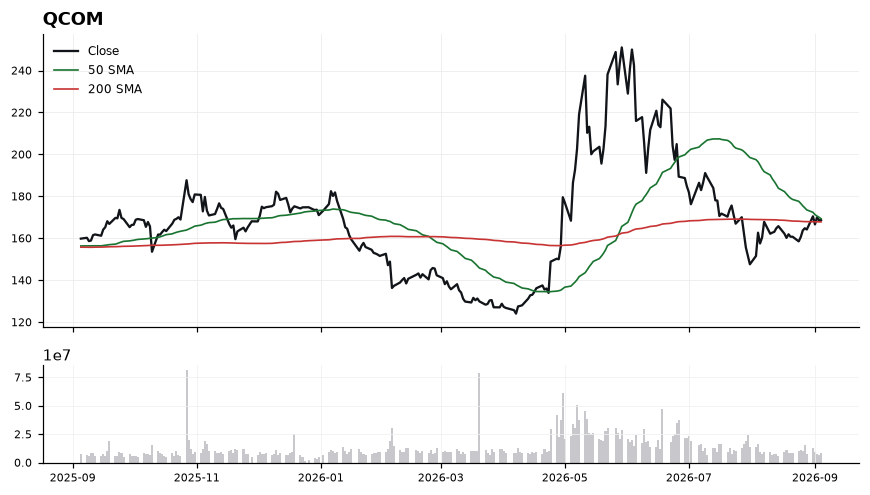
EntryPreferred trigger on a reclaim and hold above the 50-SMA at 169.31, with entries staged between 169.30–170.00; alternatively, a pullback tag of the 200-SMA near 167.85 offers a lower-risk add zone.
InvalidationInvalidation on a daily close below 166.50 (roughly 1.3% under the 200-SMA), which would break the long-term trend line and negate the MACD-crossover thesis.
TargetsFirst target 173.50, a measured move above the 50-SMA congestion → Second target 177.00, extending the recovery leg as momentum broadens
TimeframeSwing (2-6 weeks)
Inflection59
Probability83
Quality85
CVNA is trading at 74.59, holding just above both its 200-SMA (73.03) and 50-SMA (68.77), placing it at an inflection where a reclaimed long-term trend line meets a rising short-term average. With trade-quality scoring 85.2 and profit-probability 83.0, the tape favors a long working bias provided price defends the 200-SMA zone.
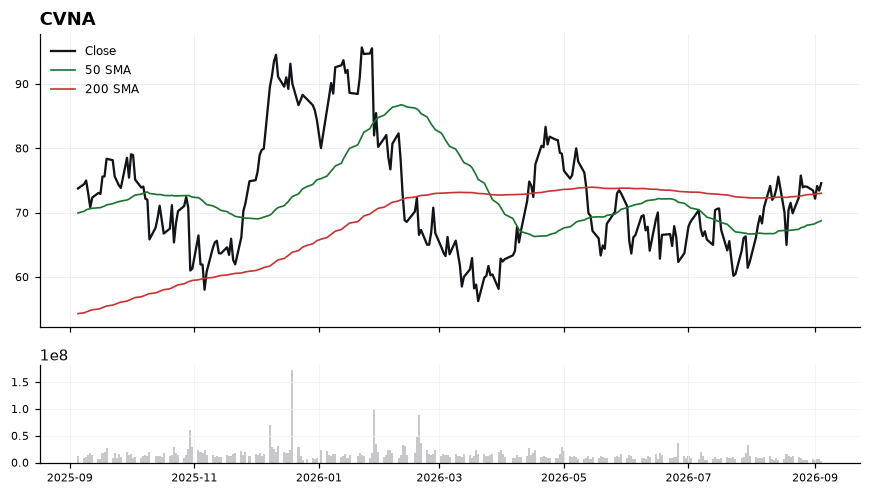
Price sits only 2.14% above the 200-SMA, a narrow buffer that keeps the reclaim tactically fragile but structurally constructive. The 50-SMA at 68.77 is now below the 200-SMA reading, so a golden-cross-in-progress dynamic is developing rather than confirmed. RSI at 56.46 is constructive without being extended, leaving room for upside continuation. MACD at 1.54 is fractionally above signal (1.53), a marginal positive cross that needs expansion to validate momentum.
EntryPreferred accumulation zone 73.00–74.00 on pullbacks toward the 200-SMA; alternatively, momentum trigger on a decisive close above 75.50 with MACD histogram expansion.
InvalidationDaily close below 68.50 invalidates the setup — that would break both the 50-SMA support and confirm rejection of the 200-SMA reclaim, flipping structure back to neutral/bearish.
TargetsFirst target 80.00 — prior resistance shelf and ~7% extension from entry → Second target 85.50 — measured move continuation if momentum broadens
TimeframeSwing (2-6 weeks)
Inflection63
Probability69
Quality93
GOOGL is coiling just above its rising 200-SMA (335.94) after slipping under the 50-SMA (348.57), setting up a classic inflection where the long-term trend is being retested with a working long bias.
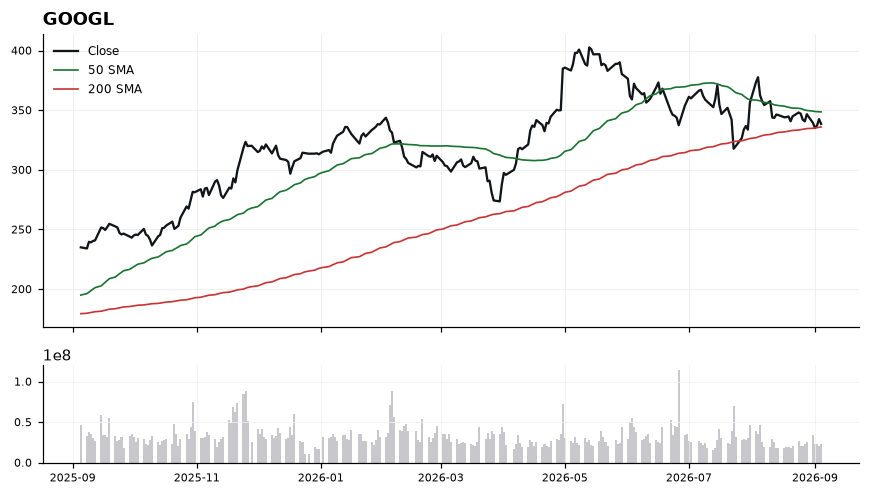
Price at 338.46 sits only 0.75% above the 200-SMA, making that level the line in the sand for trend integrity. RSI at 44.82 reflects neutral-to-soft momentum with room to turn up before any overbought concern, while MACD at -2.98 vs signal -2.60 shows momentum still negative but the gap is narrow enough to flip on a reclaim of the 50-SMA. The compression between the 200-SMA support (335.94) and 50-SMA resistance (348.57) defines a tight decision zone worth trading around.
EntryStaggered accumulation 336.00-339.00 near the 200-SMA, with a confirmation add on a reclaim/close back above the 50-SMA at 348.57.
InvalidationDaily close below 332.50; that breaks the 200-SMA (335.94) with buffer, invalidating the long-trend thesis and signaling a shift to a lower regime.
Targets353.00 — reclaim and extension through the 50-SMA (348.57) → 365.00 — measured move once momentum (MACD) crosses back above signal
TimeframeSwing (2-6 weeks)
Inflection64
Probability78
Quality79
MSTR is trading at 142.80, marginally above the 200-SMA at 139.09 (+2.67%) and materially above the 50-SMA at 103.50, framing a reclaim-of-trend setup where the prior resistance is now being tested as support.
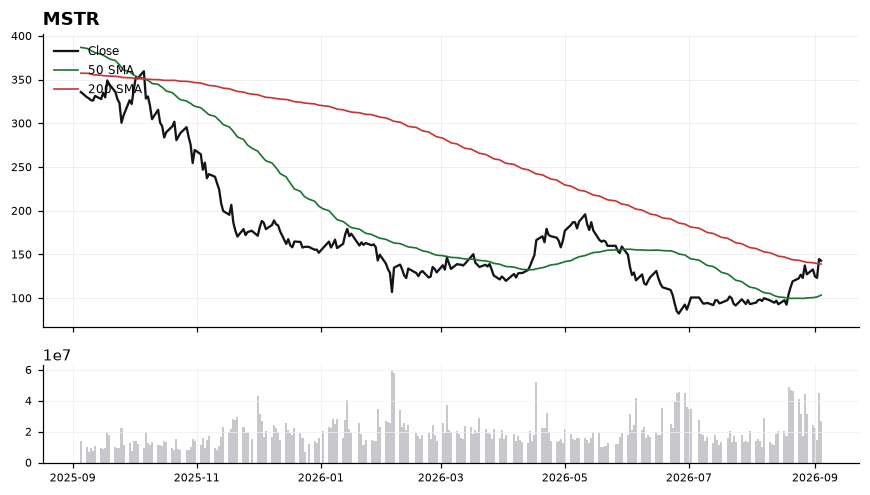
The 50-SMA (103.50) sits well below the 200-SMA (139.09), so the longer-term structure has not yet flipped, but momentum is turning up: RSI at 66.20 is firmly bullish without being extended past 70, and MACD at 9.91 over its 7.20 signal confirms positive momentum crossover. Price holding the 139.09 shelf keeps the tape constructive, while a rejection there would return MSTR to the range between the two SMAs. The narrow 2.67% cushion above the 200-SMA is the key tell — it defines both the trigger and the invalidation.
EntryPreferred accumulation zone 139.50-142.00 on constructive retests of the 200-SMA; momentum-add trigger on a daily close above 145.00.
InvalidationDaily close below 137.00 (roughly 1.5% under the 200-SMA); losing this level negates the reclaim thesis and puts price back inside the 103.50-139.09 no-man's-land.
Targets152.00 — initial extension ~9% above the 200-SMA and prior swing supply → 165.00 — measured continuation as RSI works toward overbought and MACD spread widens
TimeframeSwing (2-6 weeks)
Inflection70
Probability61
Quality87
ASAN sits precisely at its 200-day SMA (8.81) with price already reclaiming the 50-day (8.42), setting up a classic long-term trend inflection where the next directional resolution defines the multi-week bias.
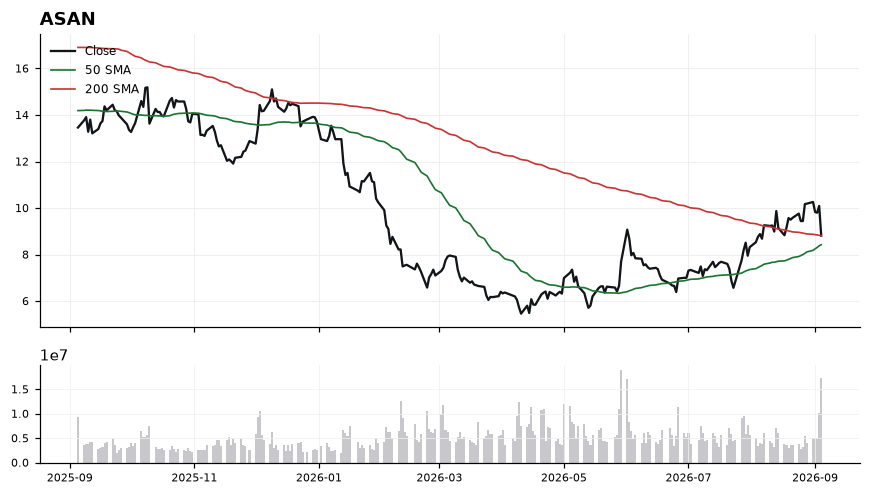
Price is mechanically at the 200-SMA (distance -0.04%) and roughly 4.6% above the rising 50-SMA at 8.42, indicating short-term trend has turned up into a major long-term pivot. RSI at 45.2 is neutral-soft, leaving room to run without overbought risk, but MACD at 0.36 sitting below its signal line at 0.46 flags waning near-term momentum and warns against chasing. The confluence of a stalling MACD into overhead 200-SMA resistance is why this is a Watch, not a Trigger — bulls need a decisive reclaim, bears a clean rejection.
EntryWatch for a confirmed daily close above 8.90 (clearing the 200-SMA at 8.81) as the long trigger; alternatively, a pullback into the 8.42–8.50 zone (50-SMA retest) offers a lower-risk entry if broader tape holds.
InvalidationInvalidation on a daily close below 8.35, which breaks the 50-SMA support and negates the higher-low structure, reverting the setup to a downtrend.
TargetsFirst target 9.35 (prior swing supply, ~6% above the 200-SMA) → Second target 9.90 (measured extension from the 50/200-SMA base)
TimeframeSwing (2-6 weeks)
Ranked by technical inflection, profit-probability, and trade quality. Educational only. Not financial advice.