Price at 28.84 sits sandwiched between the 200-SMA (28.61) below and the 50-SMA (32.11) above, framing a tight decision zone. RSI(14) at 45.64 is neutral-to-soft but has room to expand upward without being stretched. MACD at -0.14 is above its signal at -0.21, hinting at a nascent bullish crossover attempt while still under zero. The tape is not yet trending, but the compression against the 200-SMA favors a resolution attempt.
Sunday Playbook — Top 5 Setups
The day's five highest-conviction setups, ranked by technical inflection, profit-probability, and trade quality — 5 long, 0 short. Trade your plan and manage risk first. Also screened: $VRT, $GLW, $COST, $AVGO, $BMNR, $AKAM.
Inflection67
Probability83
Quality86
HIMS is coiling just above its rising 200-SMA at 28.61 (only 0.82% overhead) while the 50-SMA at 32.11 caps rallies — a classic inflection where the long-term trend line is being retested as support.
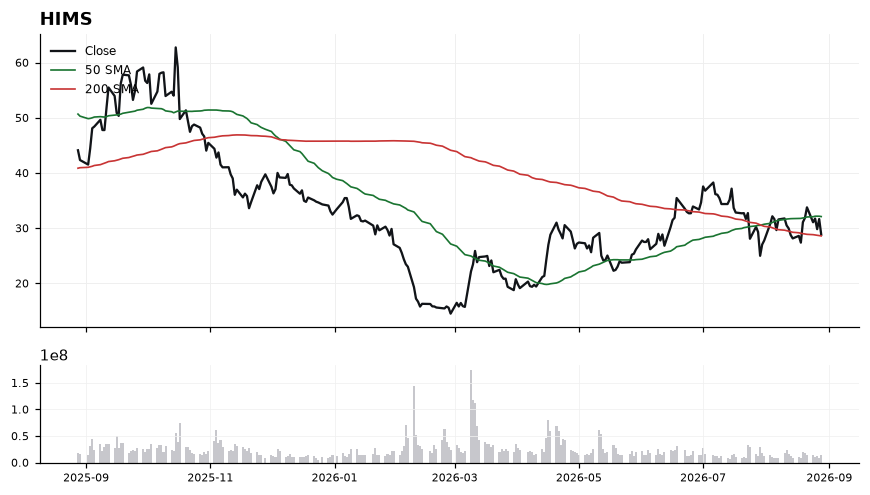
EntryStagger entries in the 28.60–29.00 zone on a hold of the 200-SMA, with an add-on trigger on a reclaim of 30.00 confirming momentum.
InvalidationA decisive close below 27.75 (roughly 1 ATR under the 200-SMA) invalidates the long thesis, signaling the 200-SMA has flipped from support to resistance.
TargetsFirst target 32.10 at the 50-SMA where sellers previously reasserted → Second target 34.50 on a 50-SMA reclaim opening the prior swing range
TimeframeSwing (2-6 weeks)
Inflection67
Probability78
Quality85
IBIT trades at 43.90, extended above both its rising 50-SMA (37.08) and 200-SMA (42.65), with the trend-quality score of 84.7 flagging a momentum inflection as price probes fresh highs only 2.93% above long-term trend.
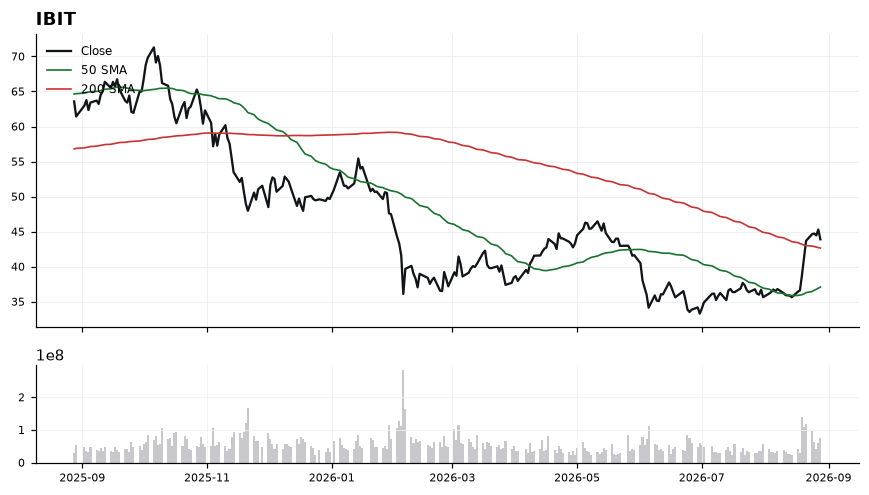
The tape is decisively trend-up: the 50-SMA sits ~10.4% above the 200-SMA (golden-cross regime) and MACD at 2.19 is running well above its 1.40 signal, confirming positive momentum acceleration. However, RSI at 70.87 is stretched into overbought territory, warning of a near-term mean-reversion risk toward the 42.65 200-SMA. The 42.65–43.00 zone is the key pivot; holding it on any pullback preserves the breakout structure, while 37.08 marks the deeper trend floor.
EntryPrefer a controlled add on pullback into 42.65–43.10 (retest of the 200-SMA/breakout shelf); a secondary momentum trigger would be a daily close and hold above 44.20.
InvalidationDaily close below 41.80 invalidates the setup — it would break the 200-SMA reclaim and signal the MACD/RSI thrust is failing, opening downside toward the 50-SMA at 37.08.
TargetsFirst target 46.00 (measured extension from the 200-SMA reclaim) → Second target 48.50 (trend-continuation objective while MACD stays above signal)
TimeframeSwing (2-6 weeks)
Inflection61
Probability83
Quality86
CVNA is trading at 74.04, sitting just 1.70% above its rising 200-SMA (72.80) after reclaiming the 50-SMA (68.06). This is a classic inflection: price is testing whether the long-term trend line becomes durable support or a rejection zone.
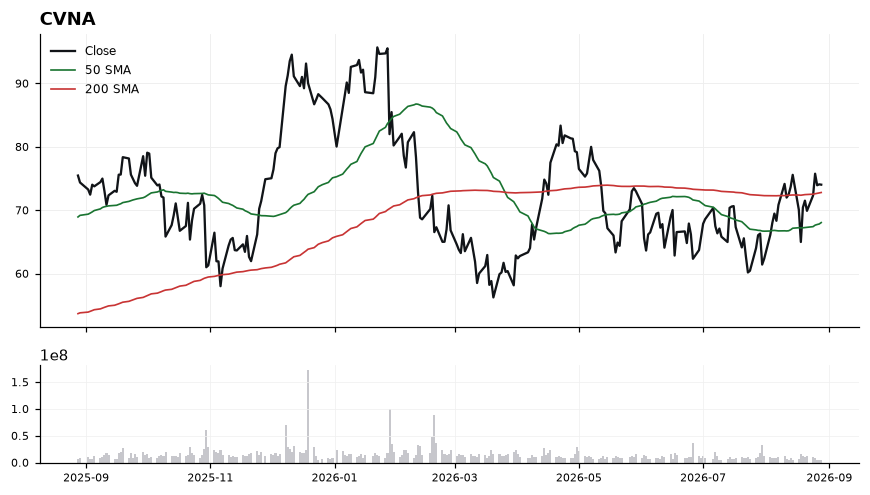
The 50-SMA at 68.06 has crossed back below price and now trails the 200-SMA at 72.80, with price extended above both — a constructive stacking in progress. RSI at 56.26 is firmly in bullish territory but not overbought, leaving room to run before momentum exhaustion. MACD at 1.75 above its signal at 1.46 confirms upside momentum is still expanding. The tight 1.70% distance to the 200-SMA means this level is the pivot: holding it validates the long bias, losing it neutralizes the setup.
EntryPreferred entry on a controlled pullback into the 72.80-73.50 zone (retest of the 200-SMA), or a momentum add on a decisive close above 75.00 with MACD still expanding.
InvalidationInvalidation on a daily close below 71.50, which would break the 200-SMA (72.80) and signal the reclaim attempt has failed, forcing a re-evaluation back toward the 50-SMA at 68.06.
TargetsFirst target 78.50 — measured extension from the 200-SMA reclaim → Second target 82.00 — trend continuation objective if momentum persists
TimeframeSwing (2-6 weeks)
Inflection60
Probability83
Quality84
SOXL is coiling just 3.98% above its rising 200-SMA (107.08) while trading 30% below its 50-SMA (160.10), a classic mean-reversion inflection where the long-term trend line is being retested as support.
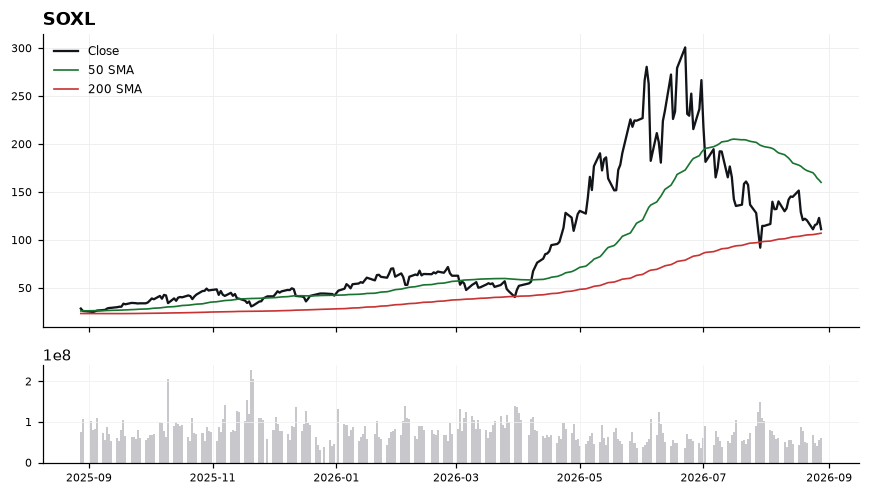
Price at 111.34 sits in a technical squeeze: RSI(14) at 40.54 is oversold-leaning but not extreme, leaving room for a bounce without being overbought. MACD at -10.09 has crossed above its signal at -10.23, a first hint of downside momentum exhaustion. However, the wide 49-point gap between price and the 50-SMA confirms the intermediate trend remains broken, so any long is countertrend against a declining medium-term structure. The 107.08 200-SMA is the pivotal line — holding it preserves the multi-quarter uptrend thesis.
EntryStagger entries on strength: initial tranche 110.00–112.00 on confirmation of the 200-SMA hold, add on reclaim of 118.00 which would signal momentum follow-through.
InvalidationClose below 105.00 invalidates the setup — it would mark a decisive loss of the 200-SMA (107.08) and shift structure to a lower-low regime.
TargetsFirst target 130.00 — mean-reversion toward the midpoint between price and the 50-SMA → Second target 155.00 — retest of the 50-SMA zone (160.10) where sellers are likely to re-emerge
TimeframeSwing (2-6 weeks)
Inflection60
Probability83
Quality79
CRCL is grinding higher above a rising 50-SMA (70.41) and has just reclaimed its 200-SMA (84.84), placing price at 87.14 — a textbook inflection where a recovered long-term trend needs confirmation before extension.
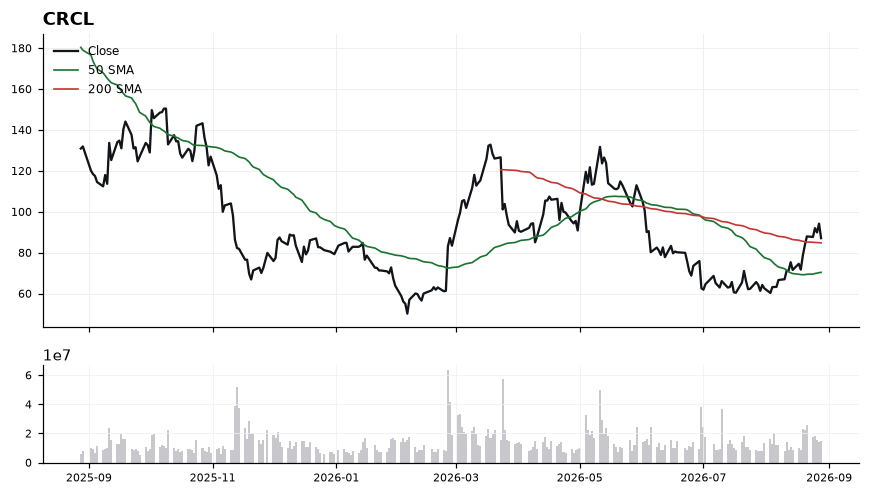
Price sits only 2.71% above the 200-SMA, so 84.84 is the pivotal line separating trend repair from failure. The 50-SMA at 70.41 is well below spot, confirming shorter-term momentum leadership, while MACD at 6.04 over signal 4.09 shows a positive and widening momentum spread. RSI at 60.94 is constructive but not yet overbought, leaving room to push toward the 65-70 zone without immediate exhaustion risk.
EntryPreferred accumulation on a pullback into the 84.84-86.00 reclaim zone; alternative momentum trigger on a decisive close above 88.50 to confirm breakout continuation.
InvalidationDaily close below 82.50 (roughly 2.7% under the 200-SMA) invalidates the reclaim thesis and signals the recovery has failed back into range.
Targets93.50 — measured extension of the current MACD-supported leg → 99.00-100.00 — psychological round-number objective as RSI approaches overbought
TimeframeSwing (2-6 weeks)
Ranked by technical inflection, profit-probability, and trade quality. Educational only. Not financial advice.