Price at 169.96 sits sandwiched between the 50-SMA (170.61) resistance and 200-SMA (167.85) support, with distance to the 200-day at only 1.26% — a tight compression zone. RSI at 54.63 is constructively above the midline without being extended, and MACD at -0.79 versus signal -2.59 shows a decisive bullish crossover with momentum improving from a negative base. The trade-quality score of 84.2 and profit-probability of 83.0 reinforce that the risk-reward geometry is favorable on a break higher, though the 50-SMA overhead remains the immediate gate.
Thursday Playbook — Top 5 Setups
The day's five highest-conviction setups, ranked by technical inflection, profit-probability, and trade quality — 5 long, 0 short. Trade your plan and manage risk first. Also screened: $VRT, $GLW, $HIMS, $AMZN, $AVGO, $CRCL.
Inflection66
Probability83
Quality84
QCOM is coiling right at its 50-SMA (170.61) while holding just above the rising 200-SMA (167.85), setting up a classic inflection where a reclaim of the 50-day would confirm a trend handoff back to bulls.
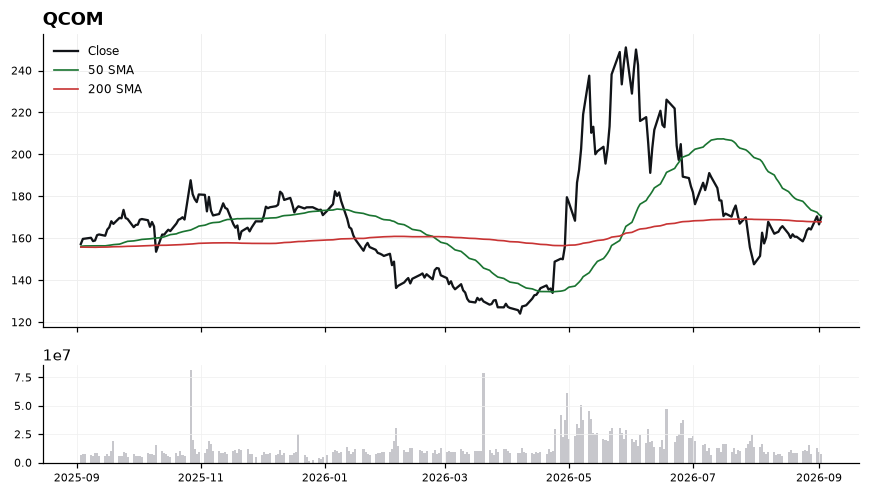
EntryLook for a reclaim and 1H close above 170.61 (50-SMA) for trigger entry, or a pullback buy into the 168.00–167.85 (200-SMA) shelf for a lower-risk fill.
InvalidationDaily close below 166.50 invalidates the setup — it would break the 200-SMA support, negate the MACD improvement, and flip the structure back to distribution.
TargetsFirst target 174.50, prior swing area and measured move from the 50/200-SMA compression → Second target 178.00, extension objective if momentum expands with RSI pushing toward 65
TimeframeSwing (2-6 weeks)
Inflection60
Probability83
Quality86
CVNA at 74.16 is holding above both its 50-SMA (68.49) and reclaimed 200-SMA (72.93), placing price at a trend-inflection where the long bias is technically confirmed but only marginally (1.69% above the 200-day).
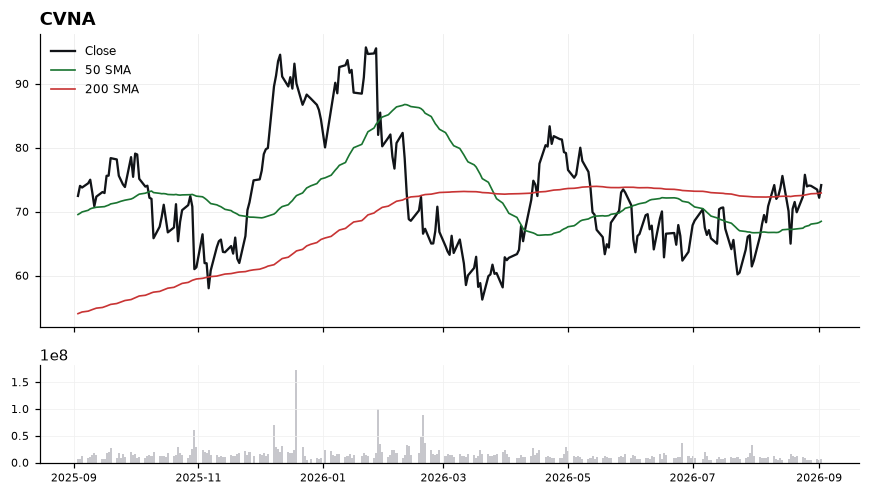
The 50-SMA sits below the 200-SMA, meaning the longer-term structure is still repairing, but price action has moved above both averages — a constructive early-stage reclaim. RSI at 55.96 shows positive momentum without overbought risk, leaving room for continuation. MACD at 1.57 is above signal (1.53) but the narrow spread signals a decelerating impulse that needs fresh follow-through. The setup scores well on trade-quality (85.5) and profit-probability (83.0), but the modest technical-inflection score (60.4) argues for disciplined execution rather than chasing.
EntryPrefer staggered entries on a pullback into the 72.93–73.50 zone (retest of the 200-SMA), or a momentum add on a decisive close above 75.00.
InvalidationInvalidation on a daily close below 68.49 (50-SMA); breaking that level would negate the reclaim thesis and re-open downside toward prior base structure.
TargetsFirst target 78.50, a measured extension from the 200-SMA reclaim → Second target 82.00–83.00, prior swing supply zone
TimeframeSwing (2-6 weeks)
Inflection63
Probability78
Quality85
IBIT is trading at 43.79, extended above both its rising 50-SMA (37.57) and reclaimed 200-SMA (42.45), placing it at an inflection where trend continuation must defend the long-term average or risk mean-reversion.
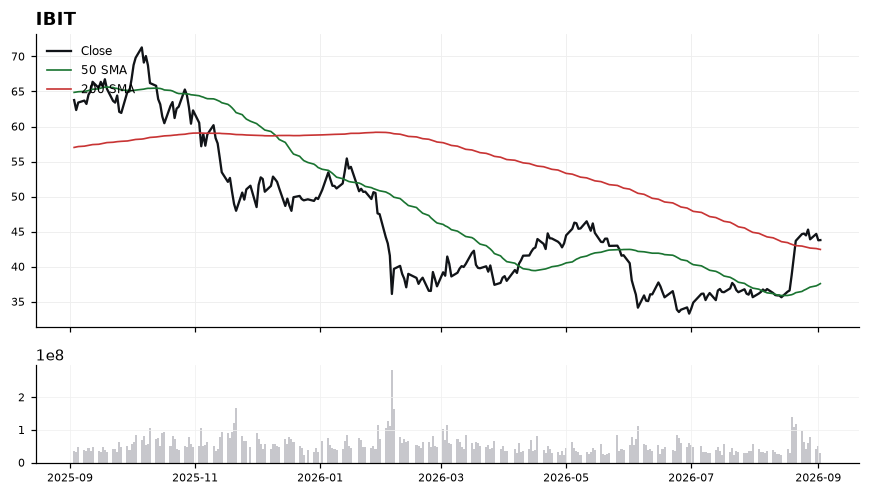
Price sits just 3.15% above the 200-SMA, with the 50-SMA well below at 37.57 confirming a bullish structural stack. Momentum is firm but stretched: RSI(14) at 67.08 is approaching overbought, while MACD at 2.14 remains above its signal line at 1.79, indicating trend persistence without yet showing negative divergence. The narrow gap to the 200-SMA means any pullback into the 42.45-43.00 shelf is the pivot that decides whether this is a base-and-go or a failed breakout.
EntryPrefer staged accumulation on a pullback into the 42.45-43.00 zone (retest of the 200-SMA); a secondary trigger is a momentum continuation close above 44.20 with MACD holding above signal.
InvalidationInvalidation on a daily close below 41.80, which would break the 200-SMA support and signal loss of the reclaimed trend regime.
TargetsFirst target 46.50, prior swing supply area → Second target 48.75, trend extension objective
TimeframeSwing (2-6 weeks)
Inflection65
Probability69
Quality93
GOOGL is coiling directly on top of its 200-SMA (335.34) with price at 337.12, just 0.53% above long-term trend — a classic decision point where the working long bias is either confirmed by a hold or invalidated by a breach.
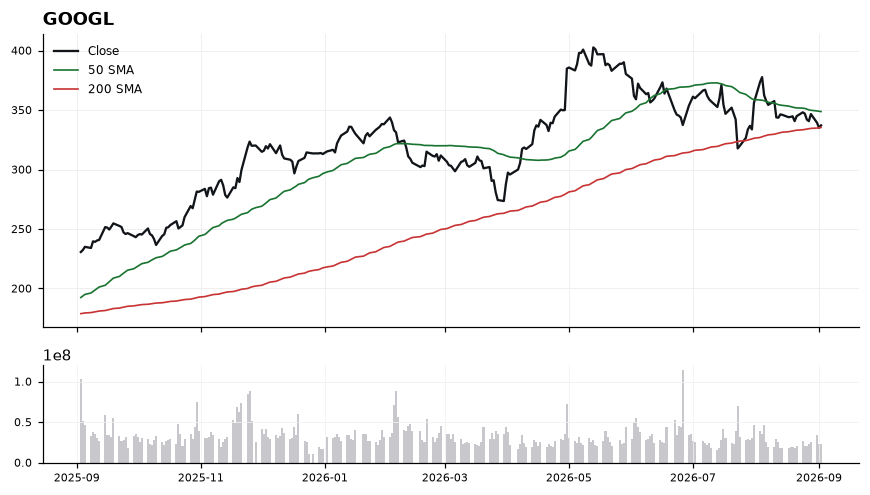
Price sits below the 50-SMA (348.73) but above the rising 200-SMA (335.34), framing a 335–349 compression zone that must resolve. RSI at 43.14 is neutral-to-soft but not oversold, leaving room for either a mean-revert bounce or further drift. MACD at -3.17 versus signal -2.40 remains negative and below signal, confirming momentum has not yet turned. The tell is whether the 200-SMA at 335.34 absorbs supply; a reclaim of the 50-SMA would flip the tape constructive.
EntryTiered accumulation on a hold of the 200-SMA: initial zone 335.50–338.00, add on a confirmed reclaim above 348.73 (50-SMA) with MACD crossing its signal line.
InvalidationDaily close below 332.00 (roughly 1% under the 200-SMA); losing the 200-SMA on a closing basis breaks the long-term trend structure and invalidates the long thesis.
TargetsFirst target 348.73 — the 50-SMA, where prior supply and mean-reversion resistance sit → Second target 358.00–362.00 — measured extension above the 50-SMA on a momentum reset
TimeframeSwing (2-6 weeks)
Inflection58
Probability83
Quality85
BMNR is trading at 23.06, holding above both its 200-SMA (22.39) and 50-SMA (17.98), with the golden-cross structure intact. The setup sits at an inflection as price probes the 200-day from above while momentum indicators show constructive but not overextended readings.
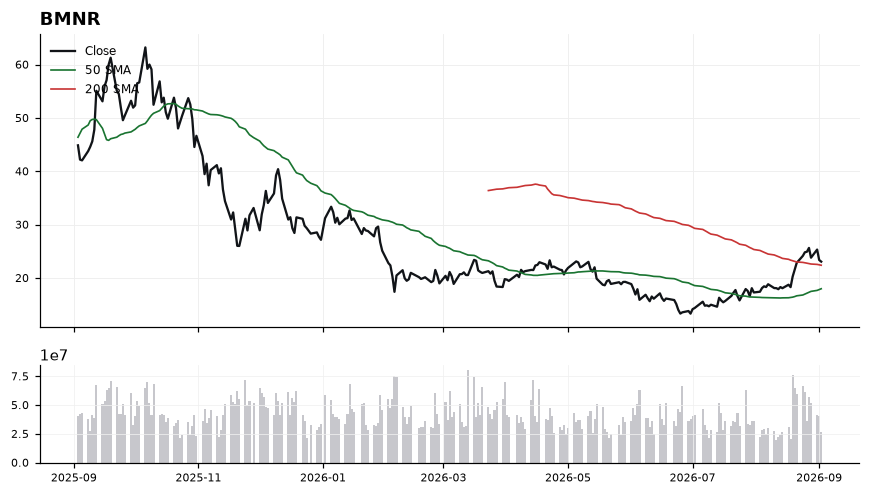
Price is only 3.01% above the 200-SMA, making that level (22.39) the pivotal line between trend continuation and failed breakout. RSI at 58.92 is bullish but has room to run before overbought, while MACD at 1.86 above its 1.73 signal confirms positive momentum with a modest, not stretched, spread. The 50-SMA at 17.98 sits well below price, reinforcing the medium-term uptrend, and trade-quality (84.6) and profit-probability (83.0) scores align with the long bias despite a middling inflection score (57.9).
EntryConsider staged entries on pullbacks into the 22.40–22.80 zone (retest of the 200-SMA), or on a momentum trigger above 23.50 with MACD spread expanding.
InvalidationA decisive close below 21.80 would invalidate the setup, signaling failure of the 200-SMA (22.39) as support and risking a mean-reversion move toward the 50-SMA.
TargetsFirst target 25.20 — prior swing resistance and measured extension from the 200-SMA reclaim → Second target 27.50 — trend-continuation objective if MACD momentum expands
TimeframeSwing (2-6 weeks)
Ranked by technical inflection, profit-probability, and trade quality. Educational only. Not financial advice.