The trend structure is constructive: price > 50-SMA > 200-SMA, confirming a rising base. RSI at 54.04 is neutral-to-firm with room to expand before overbought, while MACD at -1.56 has crossed above its signal at -2.07, signaling momentum is inflecting higher from a compressed base. However, with price only 1.90% above the 200-SMA, the setup is early and needs confirmation through the 50-SMA cluster to validate the long bias.
Thursday Playbook — Top 5 Setups
The day's five highest-conviction setups, ranked by technical inflection, profit-probability, and trade quality — 5 long, 0 short. Trade your plan and manage risk first. Also screened: $RKLB, $GOOGL, $NOW, $SPY, $ASAN, $META.
Inflection63
Probability98
Quality74
HOOD is coiling just above its 50-SMA (98.84) and 200-SMA (97.51), with price at 99.37 sitting only 1.90% above the long-term trend line — a classic inflection where a tight stack of moving averages typically resolves into a directional move.
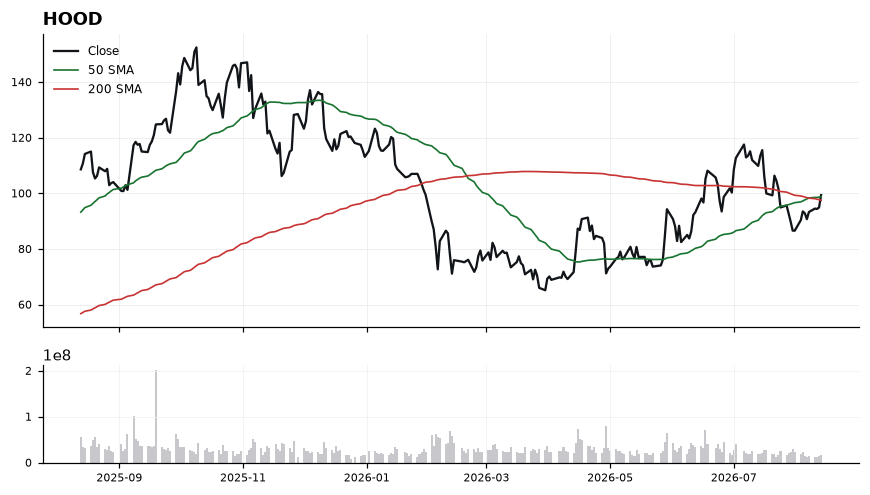
EntryPrefer a trigger entry on a reclaim and hold above 99.85–100.25 (breakout over recent congestion), or a pullback entry into the 98.85–97.55 zone where the 50-SMA and 200-SMA form layered support.
InvalidationInvalidation on a daily close below 96.90 — a break beneath the 200-SMA (97.51) would negate the momentum inflection and flip the MA stack bearish.
TargetsFirst target 103.50 (measured move from the MA compression / prior swing area) → Second target 107.25 (extension objective if MACD cross confirms with RSI pushing >60)
TimeframeSwing (2-6 weeks)
Inflection66
Probability83
Quality85
CAVA is coiling right beneath its 50-SMA (72.55) while holding above the rising 200-SMA (70.77), creating a classic inflection where a reclaim of the 50-day would flip the short-term trend back in favor of the working long bias.
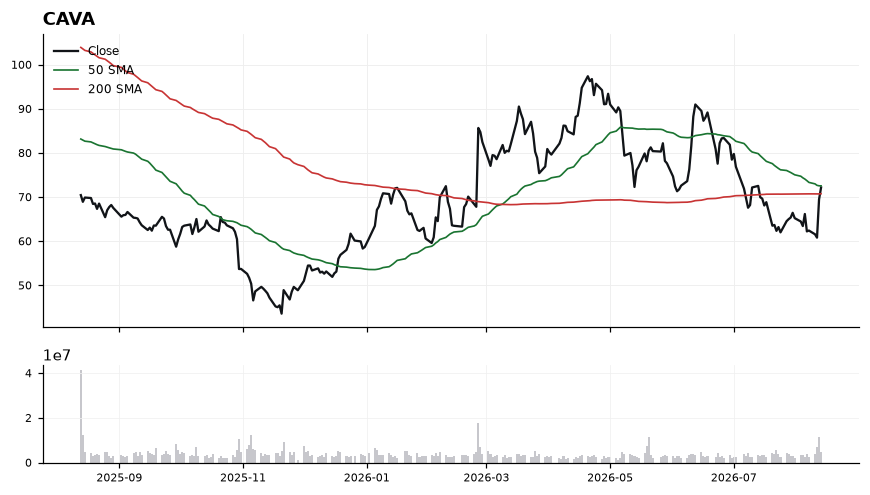
Price at 72.18 sits just 0.5% below the 50-SMA and only 2.00% above the 200-SMA, compressing the moving averages into a decision zone. RSI at 58.61 shows building momentum without being overbought, while MACD at -1.53 vs signal -2.70 confirms a bullish crossover developing from below zero — an early trend-repair signal. The stack of 200-SMA support (70.77) beneath price and the 50-SMA (72.55) acting as immediate resistance frames a tight risk/reward setup with technical-inflection scored 66.2 and trade-quality 85.3.
EntryConsider a staged approach: initial engagement on strength through 72.55 (50-SMA reclaim), with an add on a pullback into the 71.00–71.30 shelf that holds above the 200-SMA.
InvalidationA close below 70.77 (200-SMA) invalidates the setup — it would negate the MACD recovery, break the higher-support structure, and remove the basis for the long bias.
Targets74.50 — prior swing resistance and first measured move off the 50-SMA reclaim → 77.00 — extension target reflecting a full momentum thrust as RSI progresses toward the 65–70 zone
TimeframeSwing (2-6 weeks)
Inflection53
Probability98
Quality84
ALGN is coiling just above its rising 50-SMA (174.99) and well above the 200-SMA (168.54), setting up a classic trend-continuation inflection as MACD (-0.29 vs -0.59 signal) turns higher from below zero and RSI (52.2) reclaims the neutral line.
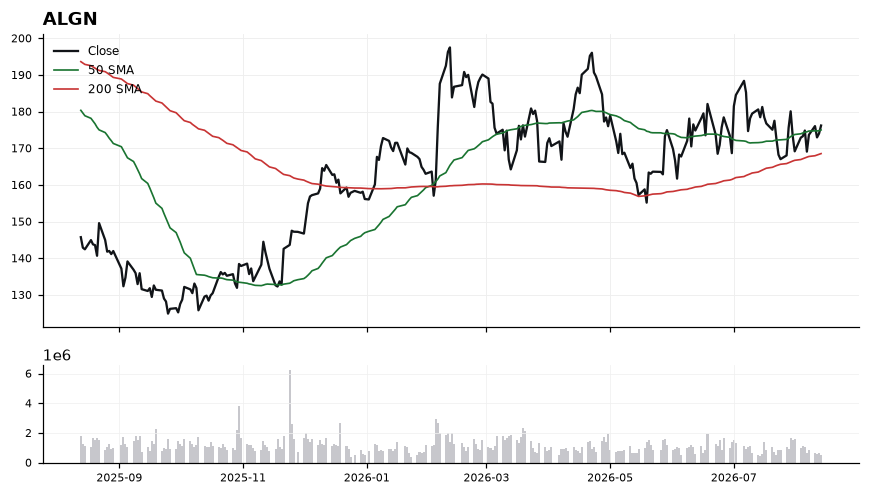
Price at 176.20 sits only 0.7% above the 50-SMA and 4.55% above the 200-SMA, keeping the intermediate uptrend structurally intact. The MACD histogram is compressing bullishly (spread of +0.30) even while both lines remain sub-zero, signaling momentum is bottoming rather than confirmed. RSI at 52.2 is constructive but non-committal, leaving room to run before overbought conditions. The 174.99 shelf is the key pivot — holding it preserves the long bias, losing it opens a drift toward the 200-SMA at 168.54.
EntryAccumulate on pullbacks into the 175.00–175.50 shelf (just above the 50-SMA), or on a momentum trigger through 177.50 with MACD crossing above signal.
InvalidationDaily close below 172.50 invalidates the setup, as it would break the 50-SMA support and expose the 200-SMA at 168.54.
TargetsFirst target 182.50 (recent swing resistance, ~3.6% upside) → Second target 188.00 (measured move extension, ~6.7% upside)
TimeframeSwing (2-6 weeks)
Inflection63
Probability83
Quality85
CVNA trades at 73.70, just 1.81% above the reclaimed 200-SMA at 72.39, with the 50-SMA (66.93) trending below price — a classic inflection where a prior downtrend line becomes contested support and trend-followers reassess.
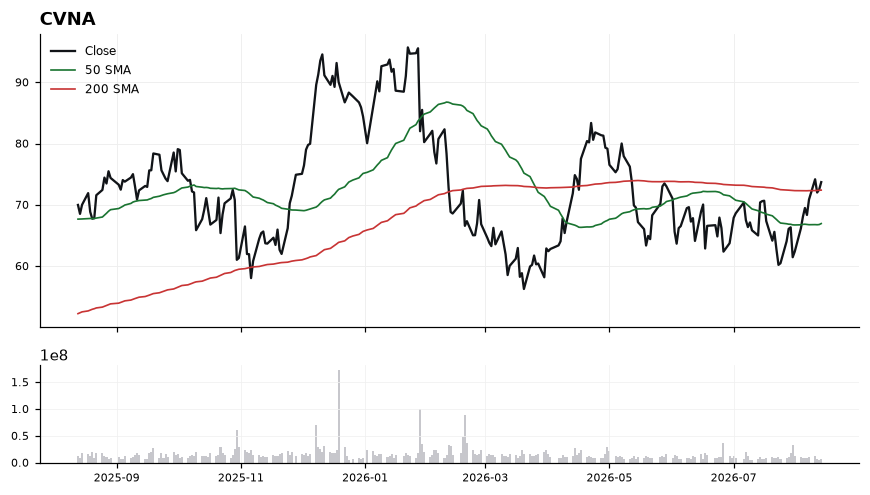
Price sits above both the 50-SMA (66.93) and 200-SMA (72.39), confirming a nascent bullish stack, while RSI at 60.66 shows momentum expansion without yet reaching overbought. MACD at 1.67 versus signal 0.64 evidences a widening positive spread, corroborating the recent trend impulse. However, the mere 1.81% cushion above the 200-SMA means the reclaim is unconfirmed and vulnerable to a retest. Trade-quality (85.4) and profit-probability (83.0) scores support the long bias, but the moderate inflection score (63.3) argues for disciplined entry rather than chase.
EntryPreferred accumulation zone 72.40–73.00 on a pullback tagging the 200-SMA and holding; alternative trigger on a decisive close above 74.50 to confirm continuation.
InvalidationBelow 71.50 (closing basis). A break there rejects the 200-SMA reclaim, flips the moving-average structure back to contested, and invalidates the long thesis.
TargetsFirst target 78.00–78.50, a measured extension from the 50/200-SMA base. → Second target 82.00, aligned with prior momentum swing objectives if MACD spread holds and RSI stays above 55.
TimeframeSwing (2-6 weeks)
Inflection65
Probability83
Quality81
COST is coiling just above both key moving averages with price at 961.85 sitting only 0.37% above the 200-SMA (958.35) and fractionally over the 50-SMA (950.59), marking a classic inflection where a reclaim needs to convert into trend.
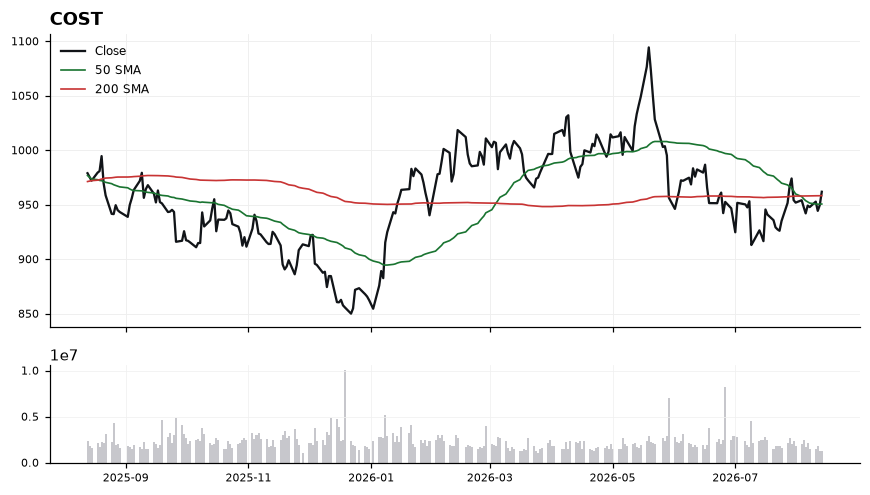
The 50-SMA at 950.59 has curled back under the 200-SMA at 958.35, but price is now pressing above both — a bullish stack attempt in progress. MACD at 1.13 versus signal -0.47 confirms momentum has crossed positive after a downcycle, while RSI at 55.88 shows constructive but not overbought thrust with room to run toward the 60-65 zone. The tight clustering of price, 50-SMA and 200-SMA within roughly 1% means directional resolution from this shelf tends to be sharp, favoring the side that holds the averages.
EntryPreferred entry on a hold of the 958-962 shelf (200-SMA reclaim zone), with an add trigger on a decisive close above 968 confirming acceptance over the flat base.
InvalidationInvalidation on a close back below 948, which would forfeit both the 50-SMA and the reclaim of the 200-SMA and flip momentum structure back to neutral-bearish.
TargetsFirst target 985-990, the prior supply shelf and measured move from the base → Second target 1010-1015, extension objective on continuation
TimeframeSwing (2-6 weeks)
Ranked by technical inflection, profit-probability, and trade quality. Educational only. Not financial advice.