Thursday Playbook — Top 5 Setups

The day's five highest-conviction setups, ranked by technical inflection, profit-probability, and trade quality — 5 long, 0 short. Trade your plan and manage risk first. Also screened: $IGV, $ETOR, $GOOGL, $HIMS, $COST, $POET.

1$FSLRHotLongMedium convictionscore 78
Inflection61
Probability98
Quality78

FSLR is coiling right at its 50-SMA (244.03) after reclaiming the 200-SMA (234.32), setting up a classic inflection where a decisive break of the moving-average cluster could resolve the trend.
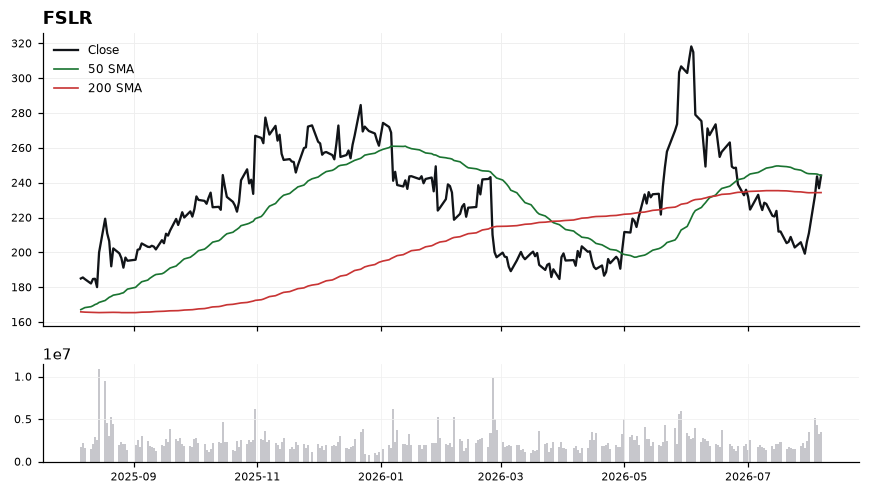
FSLR chart with 50 and 200 day moving averages

Price at 244.14 is sitting fractionally above the 50-SMA (244.03) and 4.19% above the 200-SMA (234.32), which is the technical demarcation between recovery and a fresh uptrend. RSI at 61.48 shows constructive momentum without being overbought, leaving room to run. MACD at -0.48 has crossed sharply above its signal at -6.29, a strong momentum inflection confirming buyers are back in control even though the absolute level remains sub-zero.

EntryConsider staged entries on a confirmed close above 244.03-244.14, or on a pullback that holds the 234.32 (200-SMA) shelf.
InvalidationA decisive break and close below 234.32 would invalidate the setup, signaling loss of the 200-SMA reclaim and reverting the structure to neutral/bearish.
TargetsFirst target near 254.00, roughly 4% above the 50-SMA where prior supply typically re-emerges → Second target near 265.00, extending the move if MACD crosses above zero and RSI holds >60
TimeframeSwing (2-6 weeks)
2$HDTradedLongMedium convictionscore 77
Inflection66
Probability83
Quality86

HD is testing a bullish inflection, trading at 349.52 just 0.35% above its 200-SMA (348.30) after reclaiming its 50-SMA at 333.83 — a golden-cross-adjacent posture that frames the working long bias.

HD chart with 50 and 200 day moving averages

Momentum is confirming price: RSI(14) at 57.80 sits in bullish territory without being overbought, while MACD at 2.82 has crossed above its signal line at 1.46, a positive momentum expansion. The 50-SMA (333.83) has curled up beneath the 200-SMA (348.30), and price is holding just above both, turning the 348 zone from resistance into potential support. Failure to sustain above the 200-SMA would neutralize the setup, so the current 0.35% cushion is the pivot to watch.

EntryPreferred accumulation on a controlled pullback into 348.30–345.00 (200-SMA retest); alternative breakout add above 352.00 on strength that holds the 200-SMA.
InvalidationClosing break below 333.83 (50-SMA) invalidates the thesis, signaling loss of the reclaimed trend structure and a likely drift back toward prior base.
TargetsFirst target 362.00, a measured extension from the 200-SMA reclaim → Second target 375.00, capturing continuation as MACD momentum runs
TimeframeSwing (2-6 weeks)
3$PLTRHotLongMedium convictionscore 73
Inflection66
Probability78
Quality79

PLTR is trading at 155.92, extended above both the 50-SMA (131.81) and 200-SMA (152.33), with the working long bias supported by an inflection score of 65.5 and trade-quality 79. The setup is at a decision point because price is only 2.36% above the reclaimed 200-day, converting that level into first-test support while momentum runs hot.

PLTR chart with 50 and 200 day moving averages

Trend structure is constructive: the 50-SMA at 131.81 sits well below the 200-SMA at 152.33, but price above both signals an active recovery attempt. MACD at 4.91 versus signal 1.21 shows a wide positive spread, confirming momentum expansion, while RSI at 66.37 is strong but not yet stretched into classic overbought (>70). The main risk is the thin 2.36% cushion to the 200-SMA — a pullback to that zone is on the table and would be the higher-quality entry rather than chasing at 155.92.

EntryPreferred accumulation zone 152.50–154.00 on a pullback into the 200-SMA (152.33) shelf; secondary trigger on a strong daily close back above 156.50 that holds recent highs.
InvalidationDaily close below 149.50 (roughly 2% under the 200-SMA); losing the 200-day cleanly would invalidate the reclaim thesis and shift structure back toward the 50-SMA at 131.81.
TargetsFirst target 165.00 — measured continuation as momentum extends above the 200-SMA reclaim → Second target 172.50 — trend extension objective while MACD spread remains positive
TimeframeSwing (2-6 weeks)
4$ALGNTradedLongMedium convictionscore 71
Inflection63
Probability69
Quality86

ALGN is coiling just above its 200-SMA at 167.56 while capped by the 50-SMA at 174.48, setting up a classic inflection where a resolution either way should carry momentum. With price at 169.08 and only 0.90% above long-term trend support, the risk-reward for a long-biased trade is being defined at a well-marked line in the sand.

ALGN chart with 50 and 200 day moving averages

Price is pinned in a narrow band between rising trend support (200-SMA 167.56) and reclaimed resistance (50-SMA 174.48). RSI at 44.80 signals neutral-to-soft momentum with room to expand higher without being overbought, while MACD at -1.06 below its signal at -0.68 confirms downside momentum has not yet flipped. The tight 0.90% cushion to the 200-SMA means the tape is compressed — a hold-and-reclaim of the 50-SMA would confirm the long thesis, while a decisive loss of 167.56 would negate it.

EntryPrefer staged entries: initial tranche 168.00–169.50 while price holds above the 200-SMA (167.56); add on confirmed reclaim/close above the 50-SMA at 174.48.
InvalidationInvalidation on a daily close below 165.50 (roughly 1.2% under the 200-SMA); breaking that level signals loss of long-term trend support and flips the working bias from Long to neutral/short.
TargetsFirst target 174.48 at the 50-SMA — expect initial supply here → Second target 180.00–182.00 on a clean 50-SMA breakout with MACD cross above signal
TimeframeSwing (2-6 weeks)
5$SPYTradedLongMedium convictionscore 70
Inflection39
Probability98
Quality80

SPY trades at 768.56, well above both moving averages, with a Long working bias intact but momentum stretched — RSI at 63.69 approaches overbought territory, marking a tactical inflection where continuation must be earned from support, not chased at highs.

SPY chart with 50 and 200 day moving averages

Price sits 2.9% above the 50-SMA (746.73) and 9.41% above the 200-SMA (702.46), confirming a structurally uptrending tape. MACD at 5.07 versus signal 2.02 shows momentum expansion, but the widening gap to the 200-SMA raises mean-reversion risk. RSI 63.69 is constructive yet leaves limited runway before overbought exhaustion. Trade-quality 80.4 and profit-probability 98.0 support the long bias, while inflection score 38.9 argues for disciplined entries rather than breakout chasing.

EntryPreferred long re-entry on pullback into 752-758 (prior consolidation shelf near the rising 50-SMA at 746.73); aggressive continuation trigger on a decisive close above 770.
InvalidationInvalidation on a daily close below 746 (loss of the 50-SMA); breaking this shifts structure toward a deeper retrace to the 720s and weakens the momentum thesis.
TargetsFirst target: 782 (measured extension from current base) → Second target: 795-800 psychological/round-number zone
TimeframeSwing (2-6 weeks)

Ranked by technical inflection, profit-probability, and trade quality. Educational only. Not financial advice.