Thursday Playbook — 24 setups

Across today's universe: 15 long, 6 short, 3 on watch. Trade your plan and manage risk first.

$AAPLLong
$295.95RSI 49+10.5% vs 200d
AAPL chart

Long · last 295.95

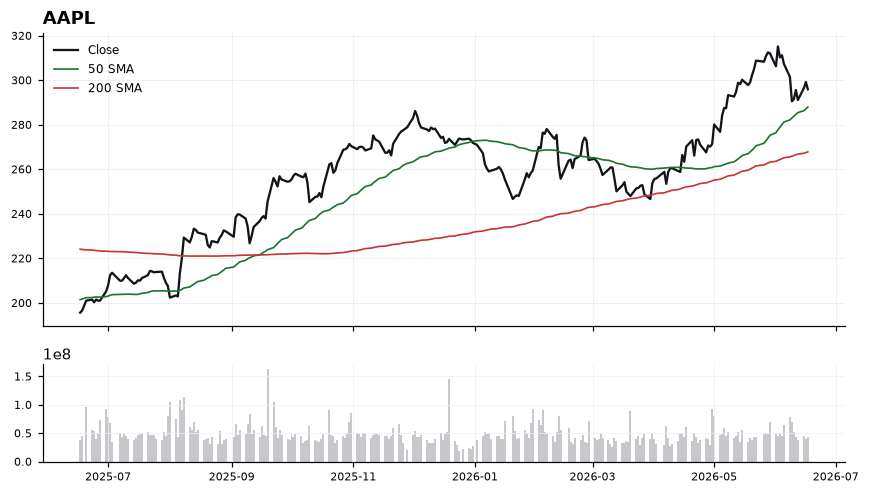
AAPL — Daily Playbook

AAPL is trading at 295.95, holding above both the rising 50-SMA (287.96) and the 200-SMA (267.85), keeping the broader trend structurally bullish with price sitting 10.49% above the long-term average. That said, momentum has cooled: RSI at 48.89 sits squarely in neutral territory, and MACD at 1.33 has crossed below its signal line at 3.72, pointing to a near-term loss of upside thrust even as the longer trend remains intact. Initial support comes in at the 50-SMA near 287.96; a clean break there would open the door toward the 267.85 level marked by the 200-SMA, while overhead resistance is defined by the recent range highs that capped this latest push. The setup is a pullback-to-trend watch — bulls will want to see price stabilize above 287.96 with RSI reclaiming 50 and MACD curling back toward its signal to validate continuation; bears get traction on a daily close beneath the 50-SMA with MACD extending its negative cross. The thesis is wrong on a decisive close below 287.96 that fails to recover quickly, which would shift the tape from "healthy consolidation" to "trend test."

$MSFTShort
$378.91RSI 35-16.2% vs 200d
MSFT chart

Short · last 378.91

MSFT — Daily Playbook

Microsoft is trading in a defined downtrend, with price at 378.91 sitting below both the 50-SMA (412.87) and the 200-SMA (451.98), and the 50 now tracking below the 200 — a bearish stack confirmed by a MACD reading of -7.30 versus its -2.29 signal line. The 16.17% gap beneath the 200-day underscores how stretched the tape is, while an RSI of 34.59 leans oversold without yet flashing a true reversal signal. Immediate resistance sits at the 50-SMA near 412.87, with the 200-SMA at 451.98 as the larger structural ceiling; downside reference comes from the recent low cluster around 378.91, and a clean break opens air below. The actionable setup is a mean-reversion watch: a daily close back above the prior swing high with RSI reclaiming 40+ and MACD curling toward its signal would be the trigger for a counter-trend probe back toward the 50-SMA. The bearish thesis remains intact while price holds beneath 412.87; the constructive read is invalidated if MSFT loses 378 on a closing basis with expanding MACD divergence to the downside.

$GOOGLLong
$363.79RSI 46+17.2% vs 200d
GOOGL chart

Long · last 363.79

GOOGL — Daily Playbook

GOOGL is consolidating just beneath its 50-day SMA (366.36) while holding well above the rising 200-day (310.32), with price 17.23% extended over that longer-term anchor — a textbook pullback within an intact primary uptrend. Momentum, however, has softened: RSI at 46.10 is neutral-to-slightly-soft, and MACD at -2.04 sitting beneath its signal at -0.45 confirms near-term downside bias hasn't fully exhausted. The immediate battleground is the 366 area; reclaiming and holding above the 50-SMA would re-open the recent highs, while failure there keeps sellers in control toward prior consolidation lows. A constructive setup triggers on a daily close back above 366.36 with MACD curling toward a bullish cross; conversely, a sustained loss of the current 363 shelf shifts attention lower, with the 200-SMA at 310.32 the structural line that defines the broader trend. The bullish thesis is invalidated on accelerating closes below the 50-SMA that fail to reclaim it within a few sessions, particularly if RSI breaks under 40 and MACD widens further beneath signal.

$AMZNLong
$237.50RSI 37+2.1% vs 200d
AMZN chart

Long · last 237.50

AMZN Daily Playbook

Amazon is caught in a transitional tape, trading at 237.50 — beneath a downward-sloping 50-SMA at 256.64 but still clinging just 2.06% above the 200-SMA at 232.71, which has become the line separating a broader uptrend from a deeper corrective phase. Momentum is soft: RSI at 36.89 is approaching oversold without yet flushing, and MACD at -5.11 sits below its signal at -3.12, confirming downside acceleration rather than stabilization. The immediate battleground is the 232.71 200-day; holding that zone keeps a mean-reversion setup toward the 50-SMA at 256.64 in play, ideally triggered by RSI reclaiming 40+ alongside a MACD/signal cross. Resistance stacks at the prior consolidation shelf near 256.64, with secondary supply likely on any retest of that broken 50-SMA. The bullish reversion thesis is invalidated on a decisive daily close below 232.71, which would shift structure to lower-highs/lower-lows and open air beneath the 200-day. Until then, this is a "watch the line" tape, not a chase.

$NVDALong
$204.65RSI 45+7.9% vs 200d
NVDA chart

Long · last 204.65

NVDA Daily Playbook

NVDA is trading at 204.65, caught between a flattening 50-SMA at 208.74 (now acting as near-term resistance) and a rising 200-SMA at 189.70, with price sitting 7.88% above that longer-term trend line — so the broader uptrend remains intact even as short-term momentum has cooled. RSI at 45.34 is neutral-to-soft, and MACD at -1.30 below its signal at 0.13 confirms that downside momentum has the upper hand on the daily timeframe. The setup is a mean-reversion squeeze: bulls need a reclaim and daily close back above the 50-SMA (208.74) to neutralize the MACD cross and open room toward recent range highs, while bears will look to press any failure under the 200–205 shelf toward the 200-SMA zone near 189.70. Trigger for a constructive read is a momentum thrust through 208.74 with RSI pushing back above 50; absent that, rallies into the 50-SMA risk being sold. The bullish thesis weakens on a decisive break and hold below the 200-SMA at 189.70, which would mark a structural shift rather than a routine pullback.

$METAShort
$567.58RSI 39-13.4% vs 200d
META chart

Short · last 567.58

META Daily Playbook

META is trading in a clear downtrend, with price at 567.58 sitting well below both the 50-SMA (622.60) and 200-SMA (655.71), and the 200-day stack -13.44% overhead reinforces the longer-term break of structure. Momentum confirms the weakness: RSI at 39.27 is sub-50 but not yet washed out, and MACD at -11.36 has slipped further beneath its signal line at -9.46, signaling continued downside pressure rather than exhaustion. Immediate resistance sits at the 50-SMA near 622–625, with the 200-SMA around 655 acting as the heavier supply ceiling; on the downside, the recent reaction zone around 560 is the first shelf, and a loss there opens air toward the prior swing lows. The setup of interest is a mean-reversion bounce only if price reclaims 600 and stabilizes — without that trigger, rallies remain sellable into the declining 50-SMA. The bearish thesis weakens if META closes back above 622.60 with RSI pushing through 50 and MACD crossing its signal; conversely, a decisive break and close below 560 invalidates any near-term basing attempt.

$TSLAWatch
$396.38RSI 45-4.9% vs 200d
TSLA chart

Watch · last 396.38

TSLA Daily Playbook

Tesla is grinding sideways-to-lower beneath both major moving averages, with price at 396.38 sitting below the 50-SMA (401.34) and the 200-SMA (416.61) — a bearish stack now that the 50-day has rolled under the 200-day vicinity. Momentum confirms the heaviness: MACD at -2.62 is well below its signal line at 0.08, and RSI at 45.34 reflects soft but not washed-out conditions, leaving room for either direction. The immediate setup is a reclaim attempt of the 50-SMA near 401 — a daily close back above that level, followed by acceptance through the 200-SMA at 416.61, would shift the short-term tone; failure there keeps sellers in control with the prior shelf around the recent lows acting as the next reference point. Conversely, losing 396 with momentum expanding (MACD diverging further below signal) opens risk toward deeper support and would widen the -4.86% gap to the 200-day. The bearish thesis is invalidated on a sustained reclaim of 416.61 with RSI pushing back above 55 and MACD crossing above signal; the bullish reclaim thesis is invalidated on a decisive rejection at the 50-SMA paired with RSI rolling back under 40.

Educational only. Not financial advice.