Price at 235.50 sits just 0.32% above the 200-SMA, making that level the line-in-the-sand for the entire uptrend structure. RSI at 44.41 is neutral-to-soft but not oversold, indicating room to absorb further downside without immediate exhaustion, while MACD at -3.63 below its signal of -2.14 confirms momentum has not yet turned. The 50-SMA at 246.38 is now overhead resistance, and the gap between the two SMAs shows a short-term pullback inside a still-intact longer-term trend — consistent with the 64.9 inflection score and 93.4 trade-quality read.
$AMZN
LongAmazon.com, Inc. · Magnificent 7 · Consumer Discretionary
Technical snapshot
as of Jul 30, 2026Chart
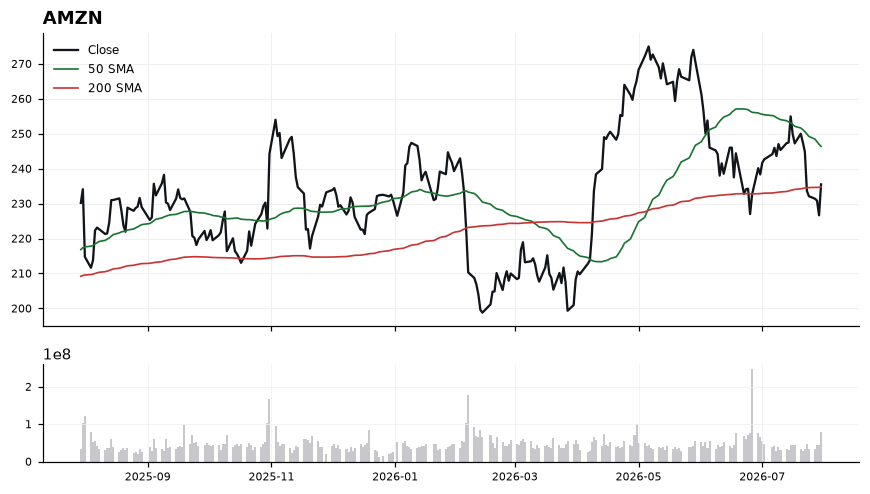
Daily close with 50/200-day SMA and volume · Jul 30, 2026
Latest read
From the Jul 30, 2026 Playbook →Recent signals
| Date | Signal | TF |
|---|---|---|
| Jul 30, 2026 | 🟢 AMZN: reclaimed the 200-day SMA (234.75) at 235.50 | DAILY |
| Jul 23, 2026 | 🔴 AMZN: closed below the 200-day SMA (234.53) at 233.66 | DAILY |
| Jun 29, 2026 | 🟢 AMZN: reclaimed the 200-day SMA (232.82) at 240.14 | DAILY |
| Jun 25, 2026 | 🔴 AMZN: closed below the 200-day SMA (232.80) at 227.01 | DAILY |
| Jun 23, 2026 | 🟢 AMZN: reclaimed the 200-day SMA (232.83) at 234.11 | DAILY |
| Jun 22, 2026 | 🔴 AMZN: closed below the 200-day SMA (232.84) at 232.79 | DAILY |
Related events
- AWS re:InventNov 30, 2026
- AMZN earningsJul 30, 2026
Playbook history
- Jul 30, 2026Long#2 · Long · 235.50
- Jul 28, 2026Short#5 · Short · 230.86
- Jul 26, 2026Short#4 · Short · 233.66
- Jul 23, 2026Short#4 · Short · 233.66
- Jul 22, 2026Long#3 · Long · 244.85
- Jul 21, 2026Long#4 · Long · 247.55
- Jul 15, 2026Long#2 · Long · 254.96
- Jul 14, 2026Long#2 · Long · 247.49
- Jul 13, 2026Long#2 · Long · 247.31
- Jul 12, 2026Long#4 · Long · 245.34
- Jul 9, 2026Long#3 · Long · 247.04
- Jul 8, 2026Long#1 · Long · 243.62
AMZN — frequently asked
- Is AMZN above its 200-day moving average?
- Yes — Amazon.com, Inc. ($AMZN) is trading 0.30% above its 200-day moving average (around 234.75), which reflects a long-term uptrend. (Educational only, not financial advice.)
- Is AMZN overbought or oversold?
- AMZN's 14-day RSI is 44, which is neutral. RSI above 70 is overbought, below 30 is oversold, and in between is neutral. (Educational only, not financial advice.)
- What is AMZN's RSI?
- AMZN's current 14-day RSI is 44 (neutral). (Educational only, not financial advice.)
- Is AMZN in an uptrend or a downtrend?
- AMZN's 50-day moving average (246.38) is above its 200-day (234.75), a bullish (golden-cross) structure. (Educational only, not financial advice.)
- What is the latest read on AMZN?
- Our most recent Daily Playbook reads AMZN as Long (#2 · Long · 235.50). (Educational only, not financial advice.)
Get AMZN signals the moment they fire
Daily Playbook reads, real-time technical alerts, and human-vetted AI analysis across the market's leaders.
Educational only. Not financial advice. Technicals are end-of-day and may lag live prices.