Price at 170.04 hugs the 200-SMA (169.16) while trading roughly 16% below the 50-SMA (203.09), signaling a stretched but stabilizing tape. RSI at 38.47 is in oversold territory without yet turning up, and MACD at -8.33 remains below its signal at -7.94, so momentum has decelerated but not confirmed a cross. The tight gap between MACD and signal suggests a bullish crossover is within reach if buyers defend the 200-day, making this a make-or-break zone for the intermediate uptrend.
$QCOM
LongTechnical snapshot
as of Jul 27, 2026Chart
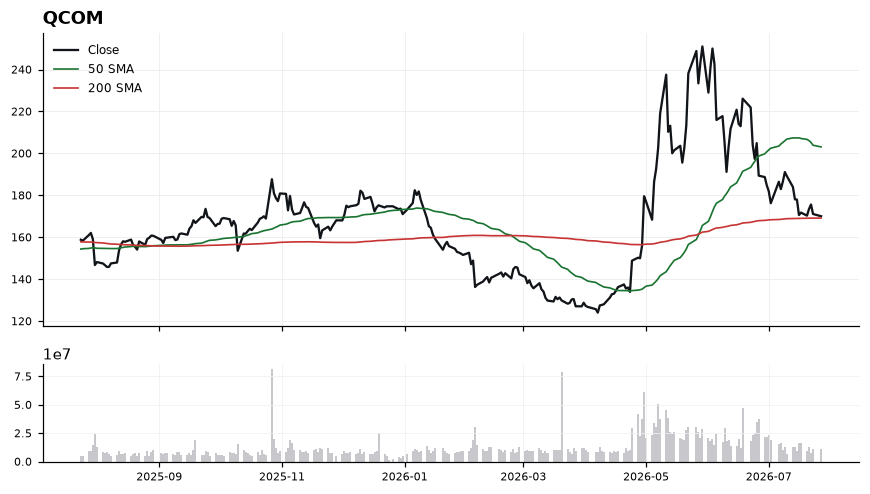
Daily close with 50/200-day SMA and volume · Jul 27, 2026
Latest read
From the Jul 27, 2026 Playbook →Playbook history
- Jul 27, 2026Long#4 · Long · 170.04
- Jul 26, 2026Long#1 · Long · 171.11
- Jul 23, 2026Long#1 · Long · 171.11
- Jul 22, 2026Long#5 · Long · 175.63
- Jul 21, 2026Long#5 · Long · 173.50
- Jul 20, 2026Long#4 · Long · 170.32
- Jul 19, 2026Long#4 · Long · 171.78
- Jul 16, 2026Long#3 · Long · 170.61
- Jul 6, 2026Long#4 · Long · 176.25
- Jul 5, 2026Long#4 · Long · 176.25
- Jul 4, 2026Long#4 · Long · 176.25
- Jul 3, 2026Long#4 · Long · 176.25
QCOM — frequently asked
- Is QCOM above its 200-day moving average?
- Yes — $QCOM is trading 0.50% above its 200-day moving average (around 169.16), which reflects a long-term uptrend. (Educational only, not financial advice.)
- Is QCOM overbought or oversold?
- QCOM's 14-day RSI is 39, which is neutral. RSI above 70 is overbought, below 30 is oversold, and in between is neutral. (Educational only, not financial advice.)
- What is QCOM's RSI?
- QCOM's current 14-day RSI is 39 (neutral). (Educational only, not financial advice.)
- Is QCOM in an uptrend or a downtrend?
- QCOM's 50-day moving average (203.09) is above its 200-day (169.16), a bullish (golden-cross) structure. (Educational only, not financial advice.)
- What is the latest read on QCOM?
- Our most recent Daily Playbook reads QCOM as Long (#4 · Long · 170.04). (Educational only, not financial advice.)
Get QCOM signals the moment they fire
Daily Playbook reads, real-time technical alerts, and human-vetted AI analysis across the market's leaders.
Educational only. Not financial advice. Technicals are end-of-day and may lag live prices.