$DELL

Long

Technical snapshot

as of Jun 17, 2026
Price419.32
RSI (14)67.60Neutral
MACD40.03Below signal

Chart

DELL price chart with 50- and 200-day moving averages

Daily close with 50/200-day SMA and volume · Jun 17, 2026

DELL — AI Infrastructure Playbook

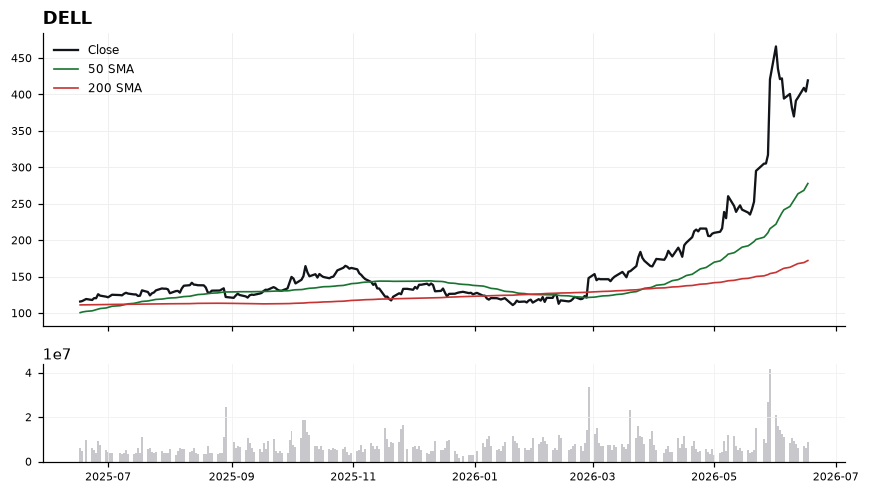
DELL is in a powerful uptrend, trading 50.9% above its 50-SMA (277.85) and an extreme 143.55% above its 200-SMA (172.17), confirming dominant trend strength but also signaling stretched conditions. RSI at 67.58 sits just below overbought, while MACD at 40.03 has slipped under its signal line at 43.14 — an early loss of upside momentum even as price holds near highs. Immediate support sits at the rising 50-SMA near 277.85 (a deep retracement zone), with nearer-term structural support likely to form on any pullback toward the high-300s; resistance is the recent local high zone just above 419, where prior supply tends to cap parabolic extensions. The setup is a momentum-pause: a daily MACD bullish re-cross with price holding above the recent breakout shelf would re-engage the trend, while continued MACD deterioration combined with a failure to reclaim highs argues for consolidation or mean-reversion. The thesis is wrong if DELL closes decisively back below the breakout shelf and RSI breaks under 50, which would shift control to sellers and open a path back toward the 50-SMA.

Playbook history

Compare DELL with

All AI Infrastructure

DELL — frequently asked

Is DELL above its 200-day moving average?
Yes — $DELL is trading 143.60% above its 200-day moving average (around 172.17), which reflects a long-term uptrend. (Educational only, not financial advice.)
Is DELL overbought or oversold?
DELL's 14-day RSI is 68, which is neutral. RSI above 70 is overbought, below 30 is oversold, and in between is neutral. (Educational only, not financial advice.)
What is DELL's RSI?
DELL's current 14-day RSI is 68 (neutral). (Educational only, not financial advice.)
Is DELL in an uptrend or a downtrend?
DELL's 50-day moving average (277.85) is above its 200-day (172.17), a bullish (golden-cross) structure. (Educational only, not financial advice.)
What is the latest read on DELL?
Our most recent Daily Playbook reads DELL as Long (Long · last 419.32). (Educational only, not financial advice.)

Get DELL signals the moment they fire

Daily Playbook reads, real-time technical alerts, and human-vetted AI analysis across the market's leaders.

Educational only. Not financial advice. Technicals are end-of-day and may lag live prices.