Price sits only 0.64% above the 200-SMA, making 639.70 the pivotal line-in-the-sand for the working long bias. RSI at 56.17 shows constructive but not overbought momentum, leaving room to extend, while MACD at 17.59 over its signal at 13.54 confirms a positive momentum crossover. The 50-SMA at 605.73 sitting below the 200-SMA still reflects a recent downtrend, so this is an early-stage recovery attempting to convert the 200-day from resistance into support.
$META
LongMeta Platforms, Inc. · Magnificent 7 · Communication Services
Technical snapshot
as of Jul 21, 2026Chart
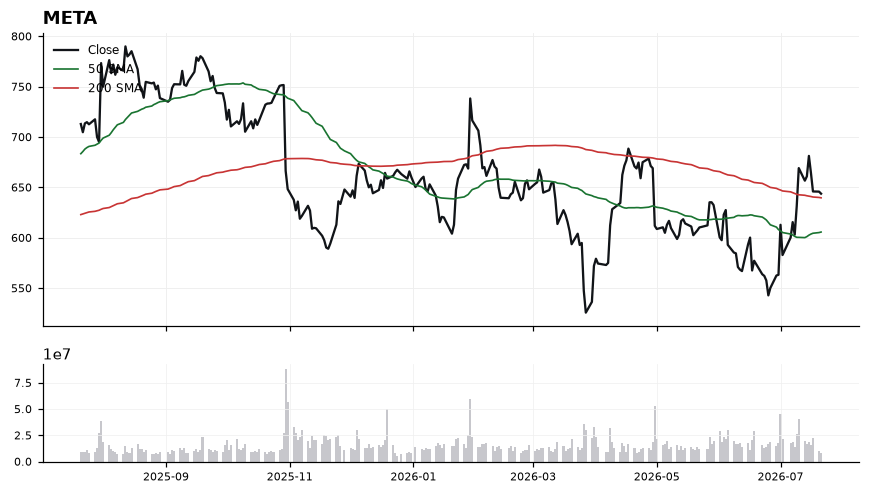
Daily close with 50/200-day SMA and volume · Jul 21, 2026
Latest read
From the Jul 21, 2026 Playbook →Recent signals
| Date | Signal | TF |
|---|---|---|
| Jul 22, 2026 | 🔴 META: closed below the 200-day SMA (639.20) at 627.17 | DAILY |
| Jul 10, 2026 | 🟢 META: reclaimed the 200-day SMA (642.72) at 669.21 | DAILY |
Related events
- META earningsJul 29, 2026
Playbook history
- Jul 21, 2026Long#1 · Long · 643.81
- Jul 20, 2026Long#1 · Long · 645.85
- Jul 19, 2026Long#1 · Long · 646.01
- Jul 16, 2026Long#2 · Long · 664.54
- Jul 15, 2026Long#3 · Long · 681.31
- Jul 14, 2026Long#1 · Long · 661.04
- Jul 13, 2026Long#1 · Long · 656.73
- Jul 12, 2026Long#2 · Long · 669.21
- Jun 18, 2026ShortShort · last 567.58
- Jun 17, 2026ShortShort · last 567.58
META — frequently asked
- Is META above its 200-day moving average?
- Yes — Meta Platforms, Inc. ($META) is trading 0.60% above its 200-day moving average (around 639.70), which reflects a long-term uptrend. (Educational only, not financial advice.)
- Is META overbought or oversold?
- META's 14-day RSI is 56, which is neutral. RSI above 70 is overbought, below 30 is oversold, and in between is neutral. (Educational only, not financial advice.)
- What is META's RSI?
- META's current 14-day RSI is 56 (neutral). (Educational only, not financial advice.)
- Is META in an uptrend or a downtrend?
- META's 50-day moving average (605.73) is below its 200-day (639.70), a bearish (death-cross) structure. (Educational only, not financial advice.)
- What is the latest read on META?
- Our most recent Daily Playbook reads META as Long (#1 · Long · 643.81). (Educational only, not financial advice.)
Get META signals the moment they fire
Daily Playbook reads, real-time technical alerts, and human-vetted AI analysis across the market's leaders.
Educational only. Not financial advice. Technicals are end-of-day and may lag live prices.