The trend structure is constructive: price > 50-SMA > 200-SMA, confirming a rising base. RSI at 54.04 is neutral-to-firm with room to expand before overbought, while MACD at -1.56 has crossed above its signal at -2.07, signaling momentum is inflecting higher from a compressed base. However, with price only 1.90% above the 200-SMA, the setup is early and needs confirmation through the 50-SMA cluster to validate the long bias.
$HOOD
LongTechnical snapshot
as of Aug 13, 2026Chart
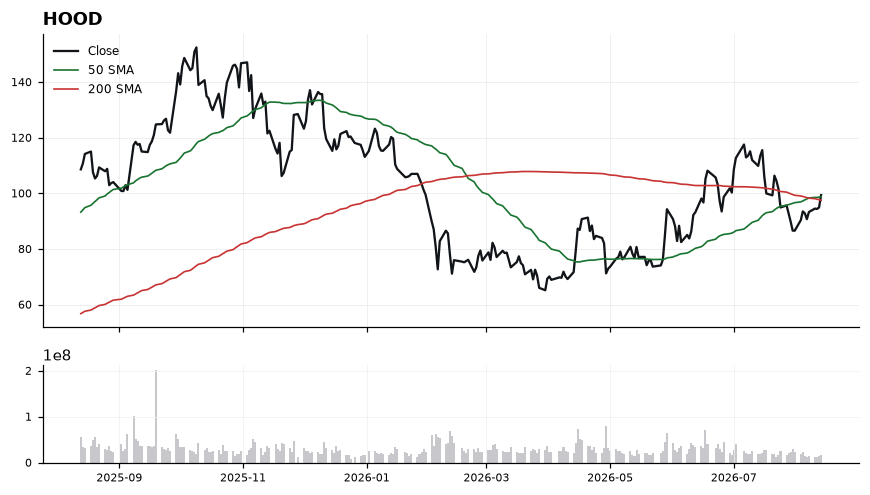
Daily close with 50/200-day SMA and volume · Aug 13, 2026
Latest read
From the Aug 13, 2026 Playbook →Playbook history
- Aug 13, 2026Long#1 · Long · 99.37
- Jul 26, 2026Long#2 · Long · 101.58
- Jul 23, 2026Long#2 · Long · 101.58
- Jun 20, 2026Long#1 · Long · 108.15
- Jun 19, 2026Long#1 · Long · 108.15
- Jun 18, 2026LongLong · last 105.20
- Jun 17, 2026LongLong · last 105.20
HOOD — frequently asked
- Is HOOD above its 200-day moving average?
- Yes — $HOOD is trading 1.90% above its 200-day moving average (around 97.51), which reflects a long-term uptrend. (Educational only, not financial advice.)
- Is HOOD overbought or oversold?
- HOOD's 14-day RSI is 54, which is neutral. RSI above 70 is overbought, below 30 is oversold, and in between is neutral. (Educational only, not financial advice.)
- What is HOOD's RSI?
- HOOD's current 14-day RSI is 54 (neutral). (Educational only, not financial advice.)
- Is HOOD in an uptrend or a downtrend?
- HOOD's 50-day moving average (98.84) is above its 200-day (97.51), a bullish (golden-cross) structure. (Educational only, not financial advice.)
- What is the latest read on HOOD?
- Our most recent Daily Playbook reads HOOD as Long (#1 · Long · 99.37). (Educational only, not financial advice.)
Get HOOD signals the moment they fire
Daily Playbook reads, real-time technical alerts, and human-vetted AI analysis across the market's leaders.
Educational only. Not financial advice. Technicals are end-of-day and may lag live prices.