Price sits just 0.04% above the 200-SMA (369.55) but 3.9% below the 50-SMA (384.84), signaling short-term weakness inside a still-intact longer trend. RSI at 43.33 is soft but not oversold, leaving room for either a bounce or a flush. MACD at -8.08 remains below its signal (-6.41) and has not yet crossed, so momentum is still negative and confirmation is pending. The confluence of the 200-SMA acting as support and RSI stabilizing above 40 is the pivot to watch.
$AVGO
LongBroadcom · Watchlist · Technology
Technical snapshot
as of Sep 1, 2026Chart
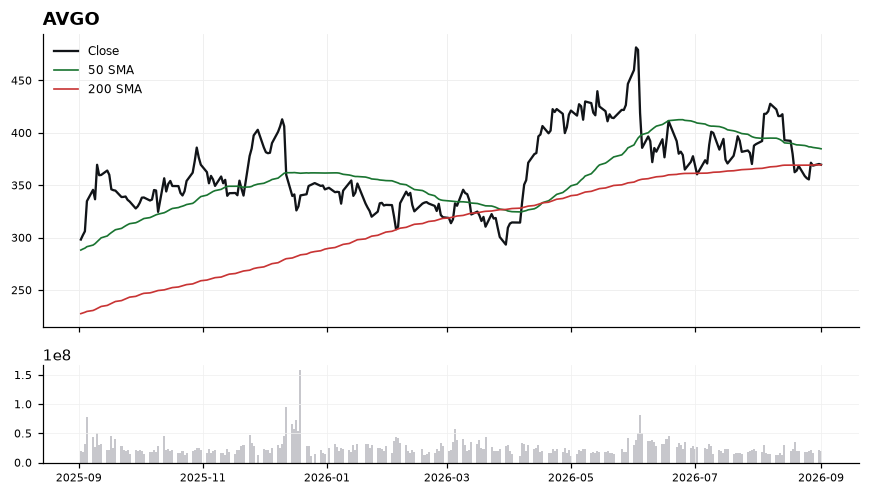
Daily close with 50/200-day SMA and volume · Sep 1, 2026
Latest read
From the Sep 2, 2026 Playbook →Recent signals
| Date | Signal | TF |
|---|---|---|
| Sep 2, 2026 | 🔴 AVGO: closed below the 200-day SMA (369.68) at 367.24 | DAILY |
| Aug 31, 2026 | 🟢 AVGO: reclaimed the 200-day SMA (369.48) at 370.34 | DAILY |
| Aug 28, 2026 | 🔴 AVGO: closed below the 200-day SMA (369.38) at 368.79 | DAILY |
| Aug 27, 2026 | 🟢 AVGO: reclaimed the 200-day SMA (369.33) at 371.54 | DAILY |
| Aug 19, 2026 | 🔴 AVGO: closed below the 200-day SMA (369.20) at 362.48 | DAILY |
| Jul 6, 2026 | 🟢 AVGO: reclaimed the 200-day SMA (361.52) at 373.90 | DAILY |
| Jul 2, 2026 | 🔴 AVGO: closed below the 200-day SMA (361.45) at 360.45 | DAILY |
Playbook history
- Sep 2, 2026Long#2 · Long · 369.68
- Sep 1, 2026Long#2 · Long · 369.68
- Aug 31, 2026Long#3 · Long · 370.34
- Aug 27, 2026Long#4 · Long · 371.54
- Aug 18, 2026Long#5 · Long · 380.00
- Aug 2, 2026Long#5 · Long · 389.28
- Jul 29, 2026Long#3 · Long · 370.32
- Jul 28, 2026Long#2 · Long · 380.91
- Jul 27, 2026Long#5 · Long · 383.22
- Jul 21, 2026Long#3 · Long · 386.50
- Jul 20, 2026Long#2 · Long · 378.16
- Jul 19, 2026Long#2 · Long · 370.83
AVGO — frequently asked
- Is AVGO above its 200-day moving average?
- Yes — Broadcom ($AVGO) is trading 0.00% above its 200-day moving average (around 369.55), which reflects a long-term uptrend. (Educational only, not financial advice.)
- Is AVGO overbought or oversold?
- AVGO's 14-day RSI is 43, which is neutral. RSI above 70 is overbought, below 30 is oversold, and in between is neutral. (Educational only, not financial advice.)
- What is AVGO's RSI?
- AVGO's current 14-day RSI is 43 (neutral). (Educational only, not financial advice.)
- Is AVGO in an uptrend or a downtrend?
- AVGO's 50-day moving average (384.84) is above its 200-day (369.55), a bullish (golden-cross) structure. (Educational only, not financial advice.)
- What is the latest read on AVGO?
- Our most recent Daily Playbook reads AVGO as Long (#2 · Long · 369.68). (Educational only, not financial advice.)
Get AVGO signals the moment they fire
Daily Playbook reads, real-time technical alerts, and human-vetted AI analysis across the market's leaders.
Educational only. Not financial advice. Technicals are end-of-day and may lag live prices.