Trend structure is constructive: 50-SMA above 200-SMA with price above both, defining a stacked bullish alignment. MACD flipping positive from below zero signals momentum expansion, while RSI 62.43 confirms strength without yet flashing exhaustion (>70). However, the 15.35% gap to the 200-SMA is stretched, meaning the highest-quality long entries typically come on pullbacks toward the 50-SMA at 294.31 rather than chasing at 312.66. The technical-inflection score of 20.9 argues against fresh breakout aggression; the 98.0 profit-probability and 83.5 trade-quality favor patient adds on weakness.
$AAPL
LongApple Inc. · Magnificent 7 · Technology
Technical snapshot
as of Jul 6, 2026Chart
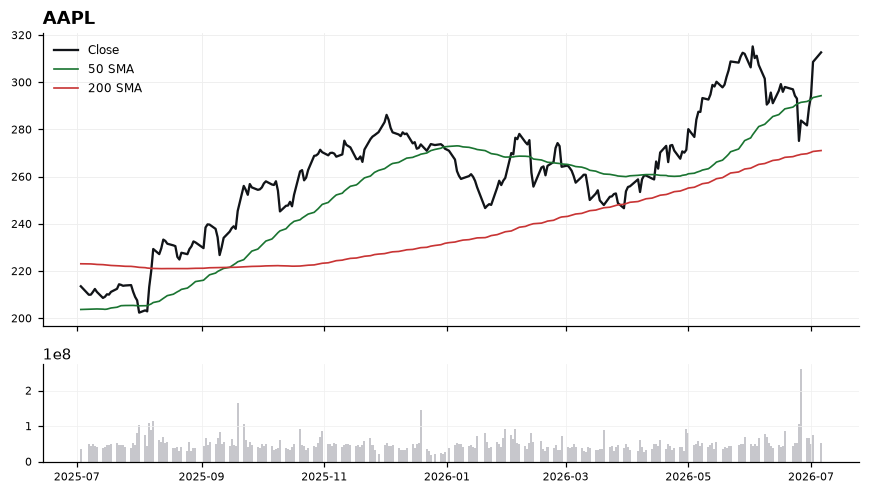
Daily close with 50/200-day SMA and volume · Jul 6, 2026
Latest read
From the Jul 7, 2026 Playbook →Related events
- Apple Fall Event (iPhone)Sep 9, 2026
- AAPL earningsJul 30, 2026
Playbook history
- Jul 7, 2026Long#5 · Long · 312.66
- Jul 5, 2026Long#5 · Long · 308.63
- Jul 4, 2026Long#5 · Long · 308.63
- Jul 3, 2026Long#5 · Long · 308.63
- Jul 2, 2026Long#5 · Long · 294.38
- Jun 30, 2026Long#5 · Long · 281.74
- Jun 29, 2026Long#4 · Long · 283.78
- Jun 28, 2026Long#4 · Long · 283.78
- Jun 27, 2026Long#1 · Long · 275.15
- Jun 26, 2026Long#1 · Long · 275.15
- Jun 25, 2026Long#4 · Long · 293.08
- Jun 24, 2026Long#4 · Long · 294.30
AAPL — frequently asked
- Is AAPL above its 200-day moving average?
- Yes — Apple Inc. ($AAPL) is trading 15.30% above its 200-day moving average (around 271.06), which reflects a long-term uptrend. (Educational only, not financial advice.)
- Is AAPL overbought or oversold?
- AAPL's 14-day RSI is 62, which is neutral. RSI above 70 is overbought, below 30 is oversold, and in between is neutral. (Educational only, not financial advice.)
- What is AAPL's RSI?
- AAPL's current 14-day RSI is 62 (neutral). (Educational only, not financial advice.)
- Is AAPL in an uptrend or a downtrend?
- AAPL's 50-day moving average (294.31) is above its 200-day (271.06), a bullish (golden-cross) structure. (Educational only, not financial advice.)
- What is the latest read on AAPL?
- Our most recent Daily Playbook reads AAPL as Long (#5 · Long · 312.66). (Educational only, not financial advice.)
Get AAPL signals the moment they fire
Daily Playbook reads, real-time technical alerts, and human-vetted AI analysis across the market's leaders.
Educational only. Not financial advice. Technicals are end-of-day and may lag live prices.