$VRT

Long

Technical snapshot

as of Jun 17, 2026
Price317.58
RSI (14)51.40Neutral
MACD-5.55Below signal

Chart

VRT price chart with 50- and 200-day moving averages

Daily close with 50/200-day SMA and volume · Jun 17, 2026

VRT Daily Playbook — AI Infrastructure

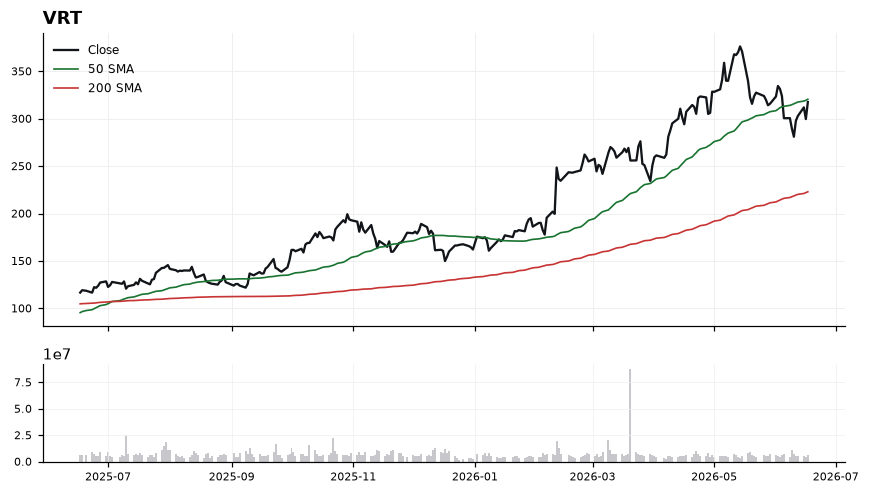
Vertiv is trading at 317.58, fractionally below its 50-day SMA (320.50) but commandingly above the 200-day SMA (222.90), leaving the longer-term uptrend intact even as near-term momentum stalls — RSI at 51.37 is dead-neutral and MACD has slipped under its signal line (-5.55 vs -4.83), pointing to a mild loss of thrust. The 50-day around 320 is the immediate pivot: reclaiming and holding above it would reopen the prior advance, while continued rejection there keeps price pinned in a consolidation. First support sits at the recent shelf near 310, with deeper structural support stepping down toward the rising 200-day at 222.90 — a 42.48% cushion that frames how stretched the bigger trend remains. The actionable setup is a momentum re-engagement: a decisive close back over the 50-SMA paired with MACD crossing back above signal would argue the pullback is finished; failure to reclaim 320 and a break of 310 with RSI rolling under 45 flips the tape to lower-high behavior. Thesis is wrong if VRT trends and closes below the 50-SMA for multiple sessions while MACD widens to the downside, signaling that the consolidation is resolving into a deeper mean-reversion toward the 200-day.

Playbook history

VRT — frequently asked

Is VRT above its 200-day moving average?
Yes — $VRT is trading 42.50% above its 200-day moving average (around 222.90), which reflects a long-term uptrend. (Educational only, not financial advice.)
Is VRT overbought or oversold?
VRT's 14-day RSI is 51, which is neutral. RSI above 70 is overbought, below 30 is oversold, and in between is neutral. (Educational only, not financial advice.)
What is VRT's RSI?
VRT's current 14-day RSI is 51 (neutral). (Educational only, not financial advice.)
Is VRT in an uptrend or a downtrend?
VRT's 50-day moving average (320.50) is above its 200-day (222.90), a bullish (golden-cross) structure. (Educational only, not financial advice.)
What is the latest read on VRT?
Our most recent Daily Playbook reads VRT as Long (Long · last 317.58). (Educational only, not financial advice.)

Get VRT signals the moment they fire

Daily Playbook reads, real-time technical alerts, and human-vetted AI analysis across the market's leaders.

Educational only. Not financial advice. Technicals are end-of-day and may lag live prices.