SPCX — Daily Playbook
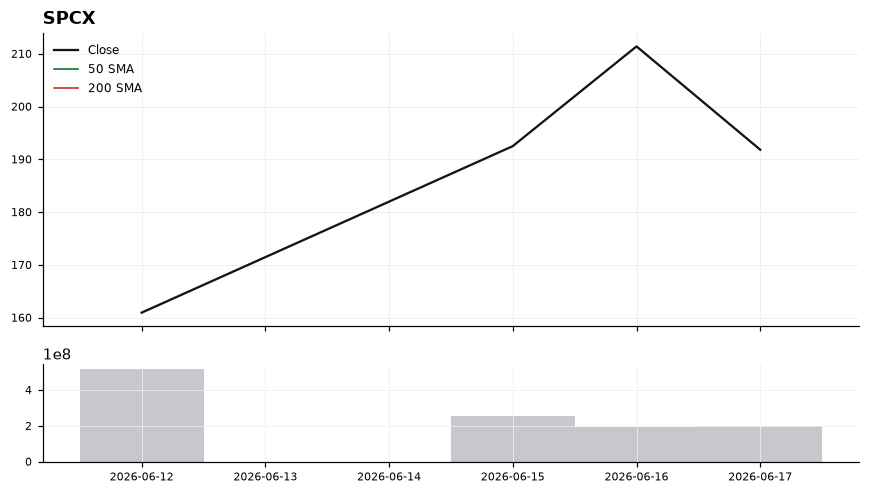
Standard trend signals are unavailable here (no 50- or 200-day SMA, RSI or MACD prints), so the read has to lean on price action and structure rather than momentum oscillators. With shares at 191.82, that level itself becomes the pivot: holding above it on a closing basis keeps near-term tone constructive, while repeated rejections from this zone would shift the burden of proof back to buyers. Without a 200-day reference, traders should map intraday and prior-session highs/lows as working support and resistance until moving-average data repopulates — treat the most recent swing low as first support and the most recent swing high as first resistance. The setup of interest is a range-break trigger: a decisive close back above the recent high opens continuation potential, while a close beneath the recent swing low neutralizes the long-side thesis. Invalidation is mechanical here — lose the prior swing low on a closing basis and the constructive read is wrong; until then, treat SPCX as a price-structure trade, not a trend-indicator trade. Position sizing should reflect the thin signal set.