$ASML

Long

Technical snapshot

as of Jun 17, 2026
Price1,867.83
50-day SMA1,569.82
200-day SMA1,261.60
RSI (14)62.70Neutral
MACD89.21Above signal

Chart

ASML price chart with 50- and 200-day moving averages

Daily close with 50/200-day SMA and volume · Jun 17, 2026

ASML — Daily Playbook

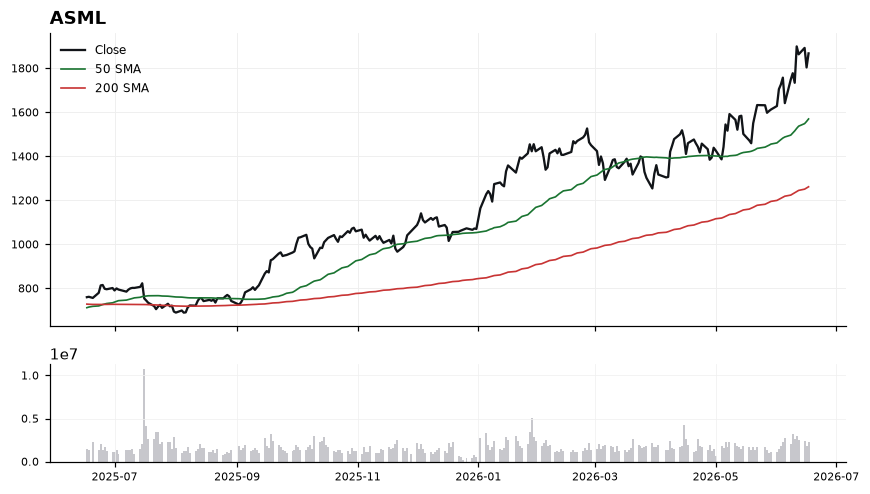
ASML is in a confirmed uptrend, trading 18.9% above its 50-SMA (1,569.82) and an extended 48.05% above its 200-SMA (1,261.60), with both averages sloping higher in classic stacked-bullish alignment. Momentum corroborates the move: RSI(14) at 62.66 is firm but not yet overbought, and MACD at 89.21 remains above its signal line at 78.34, though the narrow 10.9-point gap hints momentum is decelerating after a strong leg. The setup is a trend-continuation pullback rather than a fresh breakout chase — first support sits near the recent shelf around 1,800, with deeper structural support at the 50-SMA near 1,570; immediate resistance is the prior local high zone just above current price, where stretched conditions invite profit-taking. Trigger for continuation would be a reclaim and hold above the recent high on rising MACD, while a defensive trigger would be a MACD bearish cross combined with a loss of 1,800 on a closing basis. The bullish thesis is invalidated on a sustained break below the 50-SMA at 1,569.82, which would shift the structure from trend-pullback to distribution given how far price is extended from the 200-day.

Playbook history

Compare ASML with

All Semiconductors

ASML — frequently asked

Is ASML above its 200-day moving average?
Yes — $ASML is trading 48.10% above its 200-day moving average (around 1,261.60), which reflects a long-term uptrend. (Educational only, not financial advice.)
Is ASML overbought or oversold?
ASML's 14-day RSI is 63, which is neutral. RSI above 70 is overbought, below 30 is oversold, and in between is neutral. (Educational only, not financial advice.)
What is ASML's RSI?
ASML's current 14-day RSI is 63 (neutral). (Educational only, not financial advice.)
Is ASML in an uptrend or a downtrend?
ASML's 50-day moving average (1,569.82) is above its 200-day (1,261.60), a bullish (golden-cross) structure. (Educational only, not financial advice.)
What is the latest read on ASML?
Our most recent Daily Playbook reads ASML as Long (Long · last 1,867.83). (Educational only, not financial advice.)

Get ASML signals the moment they fire

Daily Playbook reads, real-time technical alerts, and human-vetted AI analysis across the market's leaders.

Educational only. Not financial advice. Technicals are end-of-day and may lag live prices.

$ASML Stock Analysis, Chart & Signals — 360TradingView