$TSM

Long

Technical snapshot

as of Jun 17, 2026
Price432.15
RSI (14)55.20Neutral
MACD7.76Below signal

Chart

TSM price chart with 50- and 200-day moving averages

Daily close with 50/200-day SMA and volume · Jun 17, 2026

TSM — Semiconductors Playbook

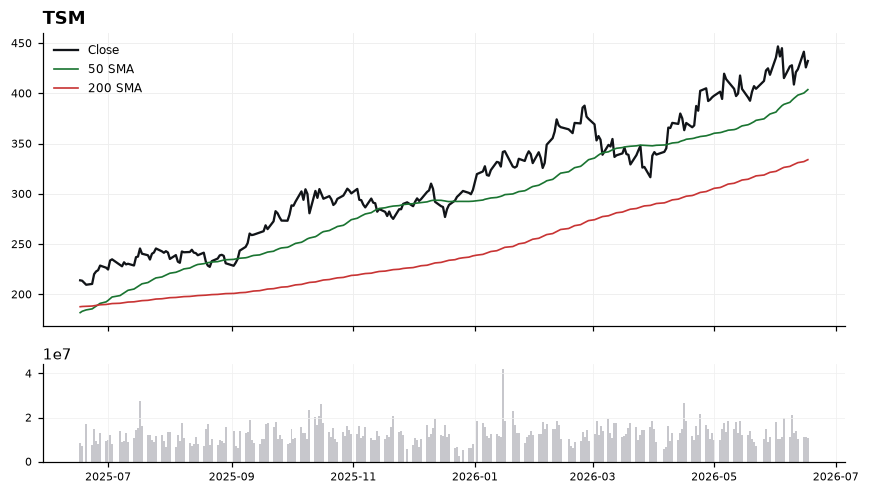
TSM trades at 432.15, holding above both the rising 50-SMA (403.69) and 200-SMA (333.98), keeping the broader uptrend structurally intact — price sits 29.39% above the 200-day, a stretched but trend-confirming gap. Momentum is more mixed: RSI at 55.24 is neutral-to-constructive, while MACD at 7.76 has crossed below its signal line at 8.82, hinting at a near-term loss of upside thrust even as the longer trend holds. Initial support sits at the 50-SMA near 403.69, with deeper trend support back at the 200-SMA near 333.98; reclaiming momentum would require MACD curling back above its signal alongside RSI pushing through the 60 zone. The setup of interest is a pullback-and-stabilize toward the 403–410 shelf, with a trigger on a MACD bullish recross or a clean reclaim of recent local highs above 432. The thesis weakens on a decisive close below 403.69, and is invalidated on sustained trade under the 200-SMA at 333.98 — that would break the prevailing trend regime rather than just cool it.

Playbook history

Compare TSM with

All Semiconductors

TSM — frequently asked

Is TSM above its 200-day moving average?
Yes — $TSM is trading 29.40% above its 200-day moving average (around 333.98), which reflects a long-term uptrend. (Educational only, not financial advice.)
Is TSM overbought or oversold?
TSM's 14-day RSI is 55, which is neutral. RSI above 70 is overbought, below 30 is oversold, and in between is neutral. (Educational only, not financial advice.)
What is TSM's RSI?
TSM's current 14-day RSI is 55 (neutral). (Educational only, not financial advice.)
Is TSM in an uptrend or a downtrend?
TSM's 50-day moving average (403.69) is above its 200-day (333.98), a bullish (golden-cross) structure. (Educational only, not financial advice.)
What is the latest read on TSM?
Our most recent Daily Playbook reads TSM as Long (Long · last 432.15). (Educational only, not financial advice.)

Get TSM signals the moment they fire

Daily Playbook reads, real-time technical alerts, and human-vetted AI analysis across the market's leaders.

Educational only. Not financial advice. Technicals are end-of-day and may lag live prices.