$AMD

Long

Technical snapshot

as of Jun 17, 2026
Price512.48
RSI (14)57.70Neutral
MACD28.47Below signal

Chart

AMD price chart with 50- and 200-day moving averages

Daily close with 50/200-day SMA and volume · Jun 17, 2026

AMD Daily Playbook

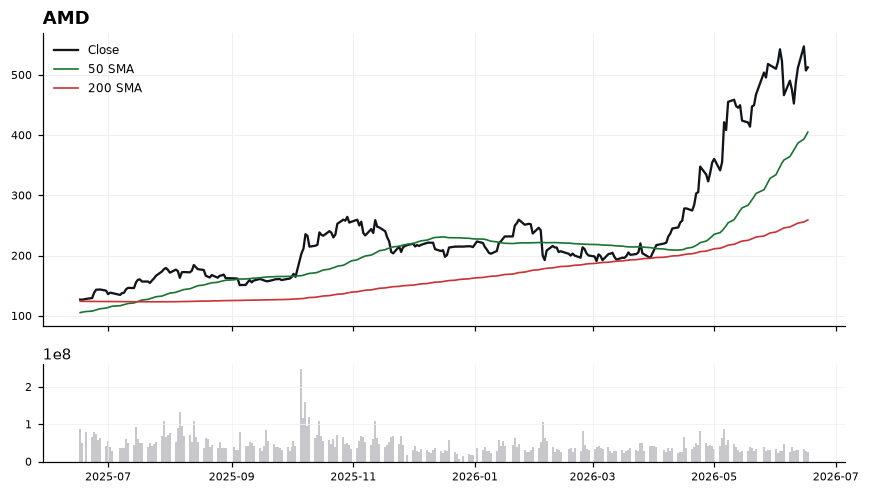
AMD remains in a powerful uptrend, trading at 512.48 — well above both the 50-SMA (404.94) and the 200-SMA (259.28), with price extended a striking 97.66% above its 200-day, signaling a mature leg rather than an early-stage breakout. Momentum, however, is cooling: RSI(14) at 57.68 has pulled back from overbought territory, and MACD at 28.47 has crossed below its signal at 33.18, a near-term deceleration warning even as the broader structure stays constructive. Initial support sits at the rising 50-SMA near 404.94, with the 200-SMA at 259.28 acting as deeper trend support; overhead, the recent highs that drove the current extension are the immediate resistance zone to reclaim. The setup is a classic pullback-in-uptrend watch — a trigger would be RSI stabilizing above ~55 alongside a MACD recross back above signal, ideally with price holding the 50-SMA on any retest. The bullish thesis weakens on a decisive close below the 50-SMA (404.94), and a sustained break of that level would shift focus toward mean reversion rather than trend continuation.

Playbook history

Compare AMD with

All Semiconductors

AMD — frequently asked

Is AMD above its 200-day moving average?
Yes — $AMD is trading 97.70% above its 200-day moving average (around 259.28), which reflects a long-term uptrend. (Educational only, not financial advice.)
Is AMD overbought or oversold?
AMD's 14-day RSI is 58, which is neutral. RSI above 70 is overbought, below 30 is oversold, and in between is neutral. (Educational only, not financial advice.)
What is AMD's RSI?
AMD's current 14-day RSI is 58 (neutral). (Educational only, not financial advice.)
Is AMD in an uptrend or a downtrend?
AMD's 50-day moving average (404.94) is above its 200-day (259.28), a bullish (golden-cross) structure. (Educational only, not financial advice.)
What is the latest read on AMD?
Our most recent Daily Playbook reads AMD as Long (Long · last 512.48). (Educational only, not financial advice.)

Get AMD signals the moment they fire

Daily Playbook reads, real-time technical alerts, and human-vetted AI analysis across the market's leaders.

Educational only. Not financial advice. Technicals are end-of-day and may lag live prices.

$AMD Stock Analysis, Chart & Signals — 360TradingView