$MU

Long

Technical snapshot

as of Jun 17, 2026
Price1,043.19
RSI (14)61.70Neutral
MACD86.94Below signal

Chart

MU price chart with 50- and 200-day moving averages

Daily close with 50/200-day SMA and volume · Jun 17, 2026

MU – Semiconductors Daily Playbook

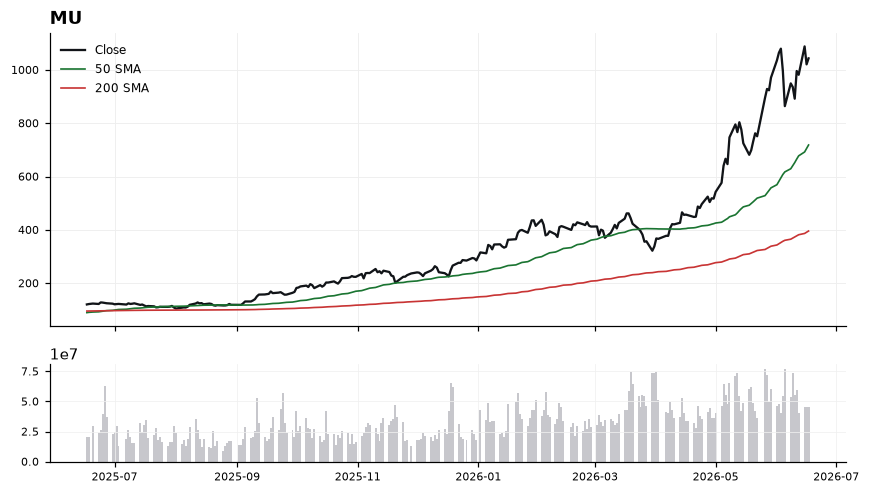
Micron is in a powerful uptrend, with price at 1,043.19 sitting well above the rising 50-SMA (718.25) and the 200-SMA (395.67) — a 163.65% premium to the long-term mean that flags extension risk even as structure remains bullish. RSI at 61.74 is firm without being overbought, but MACD at 86.94 has slipped below its signal line (91.66), hinting at fading near-term momentum despite the broader trend. Immediate support sits at the 50-SMA near 718, with the prior consolidation shelf and round-number zone around 1,000 acting as a more proximate floor; resistance is effectively the recent high band just above current price, where any breakout attempt would need to clear cleanly on expanding momentum. The setup is a momentum-pullback watch: a reclaim of the MACD signal alongside a hold above 1,000 keeps the trend setup intact, while a decisive loss of that level would shift focus toward the 50-SMA as the next test. The bullish thesis weakens on a sustained break below ~1,000 and is invalidated on a close back under the 50-SMA at 718, which would mark a structural trend change rather than a routine pullback.

Playbook history

Compare MU with

All Semiconductors

MU — frequently asked

Is MU above its 200-day moving average?
Yes — $MU is trading 163.60% above its 200-day moving average (around 395.67), which reflects a long-term uptrend. (Educational only, not financial advice.)
Is MU overbought or oversold?
MU's 14-day RSI is 62, which is neutral. RSI above 70 is overbought, below 30 is oversold, and in between is neutral. (Educational only, not financial advice.)
What is MU's RSI?
MU's current 14-day RSI is 62 (neutral). (Educational only, not financial advice.)
Is MU in an uptrend or a downtrend?
MU's 50-day moving average (718.25) is above its 200-day (395.67), a bullish (golden-cross) structure. (Educational only, not financial advice.)
What is the latest read on MU?
Our most recent Daily Playbook reads MU as Long (Long · last 1,043.19). (Educational only, not financial advice.)

Get MU signals the moment they fire

Daily Playbook reads, real-time technical alerts, and human-vetted AI analysis across the market's leaders.

Educational only. Not financial advice. Technicals are end-of-day and may lag live prices.

$MU Stock Analysis, Chart & Signals — 360TradingView