$SOFI

Watch

Technical snapshot

as of Jun 17, 2026
Price17.42
RSI (14)54.90Neutral
MACD0.14Above signal

Chart

SOFI price chart with 50- and 200-day moving averages

Daily close with 50/200-day SMA and volume · Jun 17, 2026

SOFI — Daily Playbook

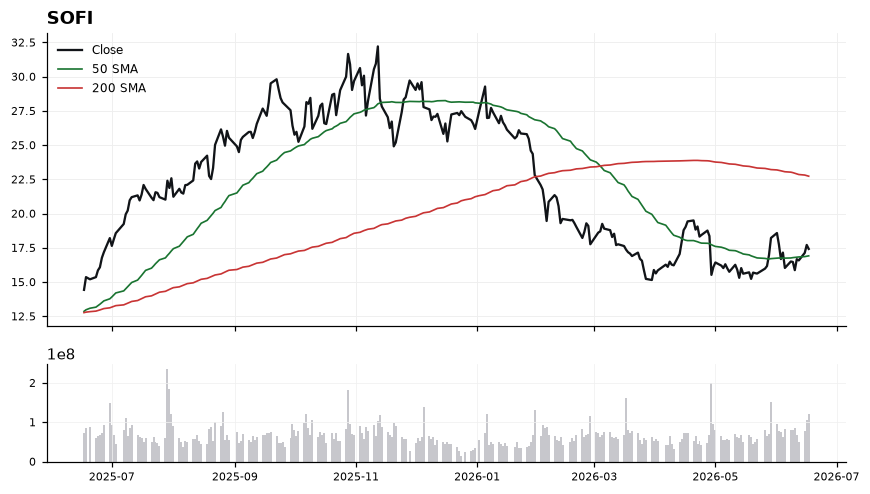
SOFI is trading at 17.42, holding above its rising 50-SMA at 16.91 but still 23.37% below its 200-SMA at 22.73, leaving the broader trend in a defined downtrend even as the short-term tape stabilizes. RSI at 54.87 is mid-range and constructive, and MACD at 0.14 over its 0.03 signal line confirms momentum has flipped positive without yet looking stretched. The immediate setup is a base-build above the 50-SMA: the 16.91 area is the line in the sand for bulls, with prior consolidation near 17.00 acting as pivot support, while overhead supply thickens into the 200-SMA at 22.73 — the level that ultimately gates any trend-change thesis. A clean trigger would be continued closes above 17.42 with MACD expanding, opening room for a probe toward the gap between price and the 200-day; failure to hold 16.91 on a closing basis, especially with MACD curling back to its signal, would invalidate the near-term recovery read and put the lower end of the recent range back in play. Treat this as a countertrend bounce inside a longer downtrend until the 200-SMA is reclaimed — that is the level that changes the structural story.

Playbook history

Compare SOFI with

All Hot

SOFI — frequently asked

Is SOFI above its 200-day moving average?
No — $SOFI is trading 23.40% below its 200-day moving average (around 22.73), which reflects a long-term downtrend. (Educational only, not financial advice.)
Is SOFI overbought or oversold?
SOFI's 14-day RSI is 55, which is neutral. RSI above 70 is overbought, below 30 is oversold, and in between is neutral. (Educational only, not financial advice.)
What is SOFI's RSI?
SOFI's current 14-day RSI is 55 (neutral). (Educational only, not financial advice.)
Is SOFI in an uptrend or a downtrend?
SOFI's 50-day moving average (16.91) is below its 200-day (22.73), a bearish (death-cross) structure. (Educational only, not financial advice.)
What is the latest read on SOFI?
Our most recent Daily Playbook reads SOFI as Watch (Watch · last 17.42). (Educational only, not financial advice.)

Get SOFI signals the moment they fire

Daily Playbook reads, real-time technical alerts, and human-vetted AI analysis across the market's leaders.

Educational only. Not financial advice. Technicals are end-of-day and may lag live prices.