$ORCL

Short

Technical snapshot

as of Jun 17, 2026
Price183.53
RSI (14)42.60Neutral
MACD-0.03Below signal

Chart

ORCL price chart with 50- and 200-day moving averages

Daily close with 50/200-day SMA and volume · Jun 17, 2026

ORCL Daily Playbook — AI Infrastructure

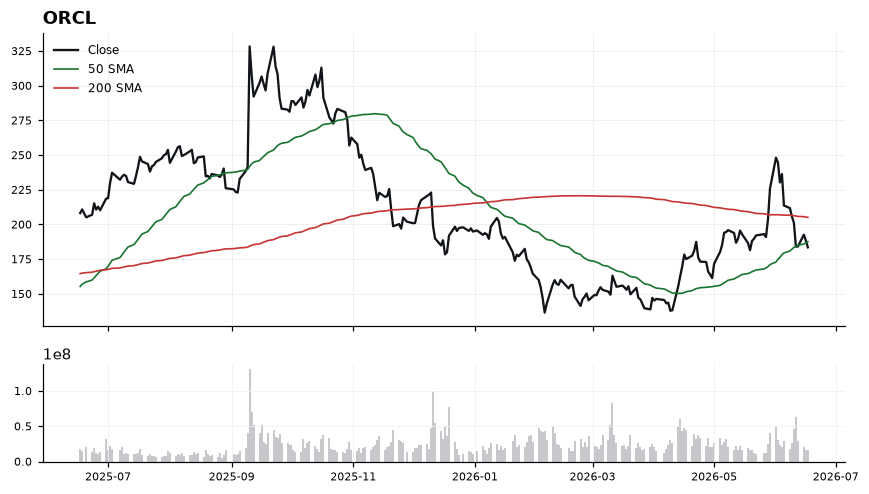
Oracle is trading at 183.53, pinned below both the 50-SMA (187.57) and the 200-SMA (205.15), confirming a corrective tone within what had been a strong AI-infrastructure uptrend; the -10.54% gap to the 200-day quantifies how stretched the pullback has become. Momentum is soft but not capitulatory: RSI at 42.62 sits in the lower-neutral zone, while MACD at -0.03 has collapsed well beneath its signal at 5.30, a sharp negative crossover that argues the path of least resistance remains lower until buyers reclaim structure. Immediate resistance is the 50-SMA at 187.57, and only a daily close back above it would shift the short-term bias; above that, the 200-SMA near 205.15 caps any larger recovery attempt. Support is the recent shelf around 183 — losing it cleanly opens air toward prior swing-low territory, while a base built here with RSI curling back through 50 would set up a mean-reversion attempt toward the 50-day. The constructive setup is a reclaim and hold of 187.57 with MACD turning up toward its signal; the thesis is wrong on sustained closes below 183 that extend the distance from the 200-SMA, signaling trend damage rather than a routine pullback.

Playbook history

Compare ORCL with

All AI Infrastructure

ORCL — frequently asked

Is ORCL above its 200-day moving average?
No — $ORCL is trading 10.50% below its 200-day moving average (around 205.15), which reflects a long-term downtrend. (Educational only, not financial advice.)
Is ORCL overbought or oversold?
ORCL's 14-day RSI is 43, which is neutral. RSI above 70 is overbought, below 30 is oversold, and in between is neutral. (Educational only, not financial advice.)
What is ORCL's RSI?
ORCL's current 14-day RSI is 43 (neutral). (Educational only, not financial advice.)
Is ORCL in an uptrend or a downtrend?
ORCL's 50-day moving average (187.57) is below its 200-day (205.15), a bearish (death-cross) structure. (Educational only, not financial advice.)
What is the latest read on ORCL?
Our most recent Daily Playbook reads ORCL as Short (Short · last 183.53). (Educational only, not financial advice.)

Get ORCL signals the moment they fire

Daily Playbook reads, real-time technical alerts, and human-vetted AI analysis across the market's leaders.

Educational only. Not financial advice. Technicals are end-of-day and may lag live prices.