Wednesday Playbook — 24 setups

Across today's universe: 15 long, 6 short, 3 on watch. Trade your plan and manage risk first.

$AAPLLong
$295.95RSI 49+10.5% vs 200d
AAPL chart

Long · last 295.95

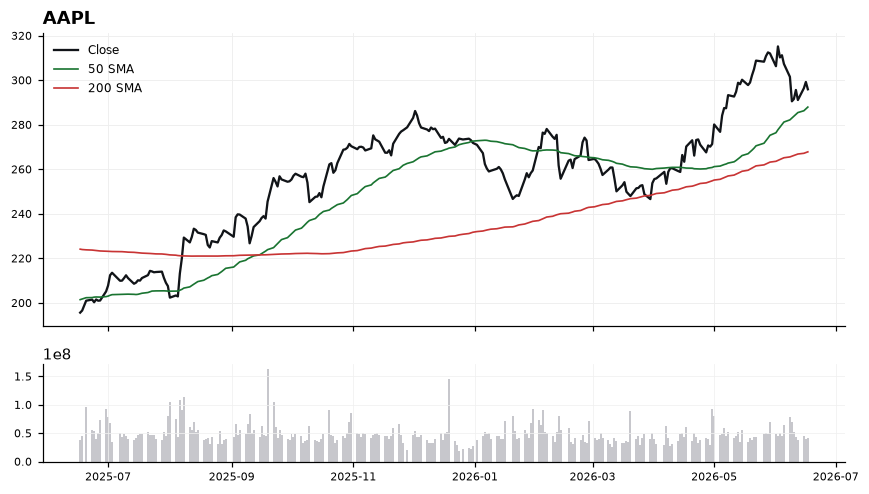
AAPL — Daily Playbook

Apple is trading at 295.95, holding above both its rising 50-SMA (287.96) and 200-SMA (267.85), keeping the broader uptrend intact with price sitting roughly 10.5% above the long-term average. That said, momentum is cooling: RSI at 48.89 is now neutral, and MACD at 1.33 has rolled under its signal line at 3.72, pointing to a near-term loss of thrust within a still-constructive structure. The 50-SMA near 288 is the first line of defense — a clean hold there keeps bulls in control, while 268 (200-SMA) marks the deeper structural floor. On the upside, reclaiming momentum would require RSI pushing back above 55 and MACD curling back toward its signal, with bulls needing to defend the 288 shelf to set up another test of the recent highs. The thesis weakens on a decisive daily close below the 50-SMA, and breaks if 268 gives way, which would flip the trend backdrop from corrective to broken.

$MSFTShort
$378.91RSI 35-16.2% vs 200d
MSFT chart

Short · last 378.91

MSFT — Daily Playbook

Microsoft is trading in a clear downtrend, with price at 378.91 sitting below both the 50-SMA (412.87) and the 200-SMA (451.98), and the 50 itself capped beneath the 200 — a bearish stacking that places shares 16.17% below the long-term mean. Momentum confirms the pressure: RSI(14) at 34.59 is approaching oversold without being washed out, and MACD at -7.30 versus its -2.29 signal line shows accelerating downside, not stabilization. Near-term resistance starts at the 50-SMA near 412.87, with the 200-SMA at 451.98 the heavier ceiling any recovery would need to reclaim; immediate support is the recent low zone just under current price, with broader support likely on extension toward the high-360s where mean-reversion buyers historically engage. The setup is a bearish-trend, oversold-bounce watch: a reactive long requires a daily close back above the 50-SMA accompanied by a MACD cross up through its signal, while a continuation short setup triggers on failed rallies into 400–413 that roll over with RSI rejecting from the 45–50 band. The bearish thesis is invalidated on a sustained reclaim of 412.87 and follow-through toward 451.98; conversely, a momentum bounce thesis is invalidated if MACD keeps widening below signal and RSI breaks under 30 with price losing the recent swing low.

$GOOGLLong
$363.79RSI 46+17.2% vs 200d
GOOGL chart

Long · last 363.79

GOOGL Daily Playbook

GOOGL is consolidating just under its 50-SMA (366.36) while holding a commanding 17.23% premium to its rising 200-SMA (310.32) — the medium-term uptrend remains intact, but short-term momentum has rolled over, with MACD at -2.04 beneath its signal at -0.45 and RSI cooling to 46.10. The 50-day at 366.36 is the immediate pivot; reclaiming and holding above it would re-engage the trend, while the 200-SMA near 310 marks the structural line bulls cannot afford to lose. The setup is a mean-reversion test: price is coiled between near-term supply at the 50-SMA and trend support well below, with RSI neutral enough to break either way. A trigger for trend-followers would be a daily close back above 366.36 with MACD curling toward its signal; a momentum-short trigger would be sustained trade beneath recent swing support with MACD continuing to widen lower. The bullish thesis is invalidated on a decisive break that fails to recover the 50-SMA and accelerates toward the 200-SMA, signaling the uptrend's first real fracture.

$AMZNLong
$237.50RSI 37+2.1% vs 200d
AMZN chart

Long · last 237.50

AMZN Daily Playbook

Amazon is caught in a transitional tape: price at 237.50 sits below the 50-SMA (256.64) but is holding above the rising 200-SMA (232.71), leaving the intermediate trend down while the longer-term uptrend remains technically intact by just 2.06%. Momentum confirms the near-term pressure — RSI at 36.89 is weak but not yet oversold, and MACD at -5.11 below its -3.12 signal shows downside momentum still expanding. The line in the sand is the 200-SMA zone near 232.71; defending it keeps a mean-reversion attempt toward the 50-SMA at 256.64 in play, with reclaim of that average needed to flip the trend back constructive. The actionable setup is reactive: watch how price behaves on a test of 232.71 — a decisive loss with MACD continuing to widen would invalidate the "higher-low above the 200-day" thesis and open air below, while stabilization with RSI curling up from the mid-30s would be the first sign buyers are stepping in. Until either the 200-SMA breaks or the 50-SMA is reclaimed, this is a no-man's-land tape where chasing in either direction carries poor risk/reward.

$NVDALong
$204.65RSI 45+7.9% vs 200d
NVDA chart

Long · last 204.65

NVDA Daily Playbook

NVDA is caught in a transitional posture: price at 204.65 sits just below the 50-SMA at 208.74 but holds a constructive 7.88% cushion above the rising 200-SMA at 189.70, so the broader uptrend is intact while the short-term tape has softened. RSI at 45.34 is neutral-to-soft, and MACD at -1.30 beneath its signal at 0.13 confirms momentum has rolled over, putting the 50-day in play as the pivot line that bulls need to reclaim. Near-term resistance stacks at the 50-SMA (208.74) and then the recent shelf above it; first support is the round 200 area, with the 200-SMA at 189.70 marking the deeper line in the sand for trend integrity. The setup is a mean-reversion watch: a daily close back above 208.74 with MACD curling toward its signal would re-open the upside structure, while continued rejection there keeps sellers in control and risks a drift toward the 200-day. Thesis invalidation comes on a decisive break and close beneath the 200-SMA at 189.70, which would flip the longer-term trend bias and force a reassessment.

$METAShort
$567.58RSI 39-13.4% vs 200d
META chart

Short · last 567.58

META — Daily Playbook

META is trading in a confirmed downtrend, with price at 567.58 sitting well below both the 50-SMA (622.60) and 200-SMA (655.71), and the 50 capped beneath the 200 — a bearish stack. The 13.44% discount to the 200-day reflects real damage, while RSI at 39.27 leans weak without yet being oversold, and MACD at -11.36 below its signal (-9.46) shows momentum still rolling lower rather than stabilizing. Near-term resistance starts at the 50-SMA zone around 622, with heavier supply at the 200-SMA near 655; immediate support is the recent reaction low area below 567, where a failure opens room toward prior structure. The setup of interest is a mean-reversion attempt: a daily close back above ~585–590 with MACD curling toward its signal would be the first trigger that selling pressure is fading, while a more durable shift requires reclaiming the 622 level. The bearish thesis remains intact as long as price holds beneath the 50-SMA and MACD stays below signal; conversely, the constructive read is invalidated on continued closes under the recent low with RSI sliding through 30.

$TSLAWatch
$396.38RSI 45-4.9% vs 200d
TSLA chart

Watch · last 396.38

TSLA Daily Playbook

Tesla is in a mild downtrend, trading 1.2% below its 50-SMA (401.34) and 4.86% under its 200-SMA (416.61) — the classic configuration where the 50-day is rolling toward the 200-day, a posture that keeps rallies sell-prone until reclaimed. Momentum confirms the heaviness: MACD at -2.62 sits well below its signal (0.08), while RSI at 45.34 is neutral-soft, leaving room to push lower before any oversold reflex. Immediate resistance stacks at 401.34 (50-SMA), then the 200-SMA at 416.61, which is the line that defines whether this remains a corrective dip or transitions back to trend; near-term support is the round 390 area, with a deeper shelf if sellers press through. The setup is a mean-reversion attempt: a reclaim and hold above 401.34 with MACD curling toward a bullish cross would shift the short-term bias and put 416.61 in play, whereas continued rejection there favors fading strength. Thesis invalidation for bulls is a daily close back under the recent low zone with RSI sliding under 40 and MACD widening lower; bears lose conviction on a decisive close above the 200-SMA at 416.61.

Educational only. Not financial advice.