Price sits only 1.16% above the 200-SMA, but a wide gap remains to the 50-SMA at 203.90, confirming an intermediate downtrend now probing longer-term support. RSI at 39.07 is sub-50 but not oversold, leaving room for upside without signaling capitulation. MACD at -8.34 versus signal -7.84 shows momentum still rolling slightly negative, so any long thesis hinges on the 200-SMA holding and MACD curling back toward its signal line.
Thursday Playbook — Top 5 Setups
The day's five highest-conviction setups, ranked by technical inflection, profit-probability, and trade quality — 3 long, 2 short. Trade your plan and manage risk first. Also screened: $ALGN, $META, $ETOR, $HPQ, $AVGO, $RDDT.
Inflection66
Probability64
Quality90
QCOM is coiling just above its 200-SMA (169.15) with price at 171.11, marking a classic mean-reversion inflection where a Semiconductor long can be tested against a well-defined line in the sand. With trade-quality scoring 89.8 and technical-inflection at 65.8, the setup earns attention despite mixed momentum.
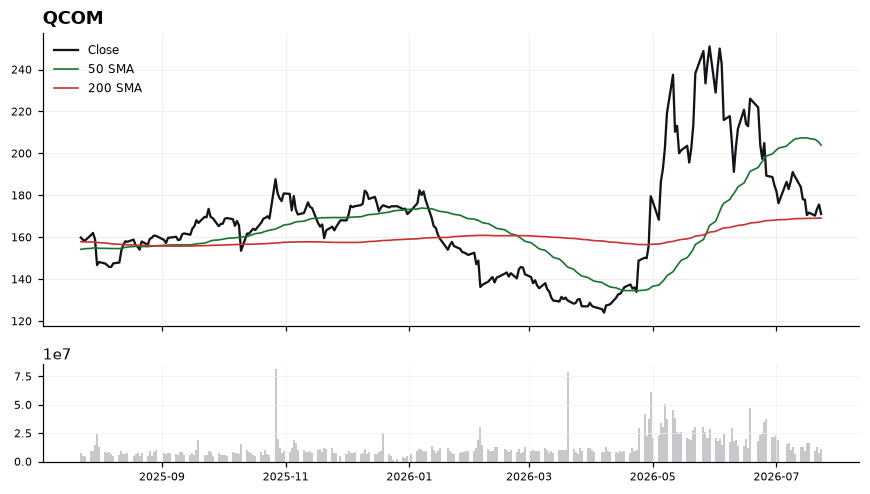
EntryStagger entries in the 169.50-172.00 zone on a hold of the 200-SMA (169.15); add-on trigger on a reclaim above 175 with MACD crossing its signal.
InvalidationDaily close below 165.50 invalidates the setup, signaling the 200-SMA has failed as support and opening a trend continuation lower toward prior demand.
TargetsFirst target 185.00 — reversion toward the mid-gap area between current price and the 50-SMA → Second target 203.00 — retest of the 50-SMA (203.90) and prior supply
TimeframeSwing (2-6 weeks)
Inflection66
Probability69
Quality80
HOOD is coiling directly on top of its 200-SMA (100.92) with price at 101.58, a classic decision point where the working long bias hinges on holding the long-term trend line. Trade-quality (80.2) and profit-probability (69.0) screens are constructive, but momentum has not yet confirmed.
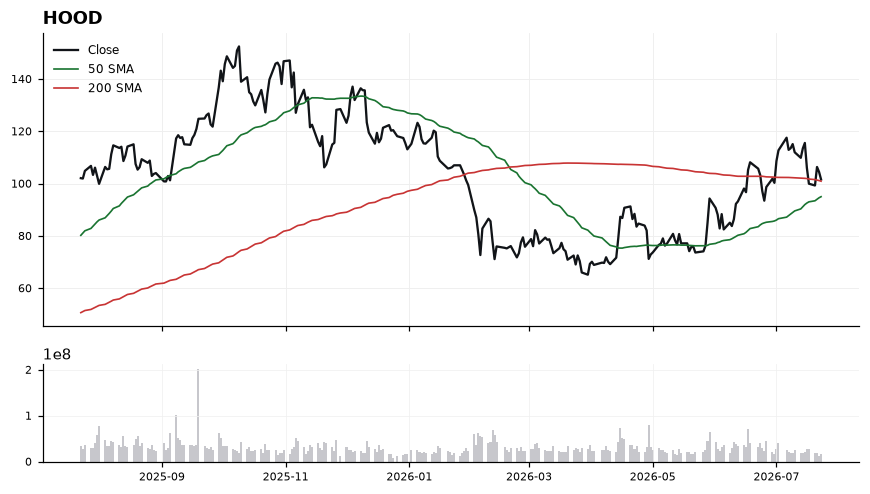
Price sits just 0.65% above the 200-SMA and comfortably above the rising 50-SMA at 94.99, keeping the broader structure intact. RSI at 48.2 is neutral-to-soft, and MACD at 2.10 remains below its signal at 4.03, signaling that short-term momentum is still cooling even as the trend backdrop stays supportive. The setup is a mean-reversion inflection: bulls need reclaim and hold above the 200-SMA to force MACD back toward a bullish cross, otherwise a retest of the 50-SMA becomes the base case. Technical-inflection score of 66 reflects this coiled, unresolved state.
EntryPreferred entry on a reclaim and hold above 102.00 with confirmation; secondary entry on a controlled pullback into the 100.90-99.50 zone that defends the 200-SMA.
InvalidationInvalidation on a daily close below 97.50; breaking that level severs the 200-SMA support, opens air down to the 50-SMA at 94.99, and negates the long thesis.
TargetsFirst target 108.00 (recovery of prior momentum shelf) → Second target 114.50 (extension objective if MACD crosses back above signal)
TimeframeSwing (2-6 weeks)
Inflection63
Probability69
Quality86
RH is coiling just above its 200-day SMA (163.82) at 166.08, with the 50-SMA (154.01) rising underneath — a classic inflection where a reclaimed long-term trend line meets a still-constructive intermediate structure.
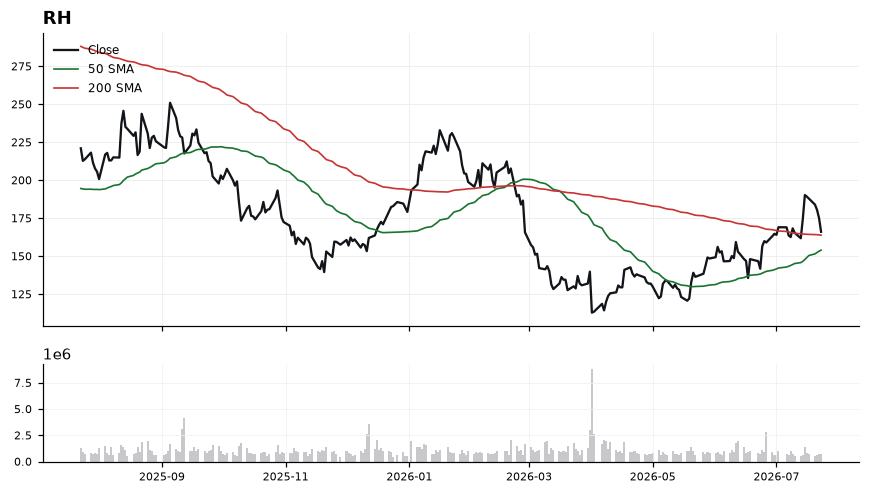
Price sits only 1.38% above the 200-SMA, making that level the pivotal line-in-the-sand for the long thesis. RSI at 49.28 is neutral, leaving room to expand upward without being stretched, while MACD at 7.08 vs signal 7.93 shows momentum has cooled and is threatening a bearish cross — hence the 'traded' rather than trend-follow posture. The bullish 50<200 gap has compressed to under 10 points, indicating a potential golden-cross setup if buyers defend the 163.82 shelf. Trade-quality (85.7) and profit-probability (69.0) support engagement, but the momentum fade argues for disciplined entry near support rather than chasing.
EntryAccumulate 164.00–166.50, ideally on a controlled retest of the 200-SMA at 163.82; add-on trigger on a reclaim and hourly close back above 167.00 with MACD re-crossing above signal.
InvalidationDaily close below 161.50 (roughly 1.4% under the 200-SMA); losing this level negates the reclaim, flips the 200-SMA to resistance, and invalidates the long bias.
TargetsFirst target 174.00 — prior swing/measured move from the 50-SMA base → Second target 182.50 — extension zone if momentum re-accelerates and RSI pushes above 60
TimeframeSwing (2–6 weeks)
Inflection69
Probability56
Quality93
AMZN is pinned against its 200-SMA (234.53) with price at 233.66, a technically pivotal zone that separates trend continuation from breakdown. With a Short bias and momentum rolling over, this is the decision line for the next multi-week leg.
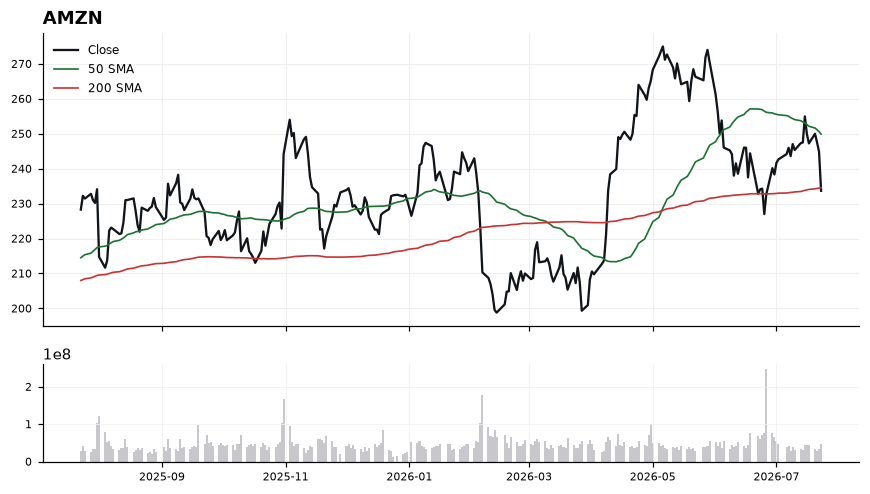
Price sits -0.37% below the 200-SMA (234.53) and roughly 6.5% under the 50-SMA (249.90), confirming a shorter-term downtrend has taken hold beneath key trend structure. RSI(14) at 38.62 is weak but not yet oversold, leaving room for further downside without an immediate mean-reversion trigger. MACD at -0.53 versus signal -0.23 shows the histogram expanding negatively, corroborating fresh bearish momentum. The 50-SMA above the 200-SMA still reflects a longer-term uptrend, so this setup hinges on whether sellers can force a decisive break of the 200-day.
EntryPrefer to fade rallies into the 234.5-237.0 zone (retest of lost 200-SMA), or add on a confirmed breakdown close below 232.5.
InvalidationInvalidation on a sustained reclaim above 240.0; that would reject the 200-SMA breakdown thesis and open a path back toward the 50-SMA at 249.90.
Targets228.0 — initial measured move as momentum extends below the 200-SMA → 220.0 — deeper flush zone if MACD momentum continues to widen
TimeframeSwing (2-6 weeks)
Inflection69
Probability56
Quality92
GOOGL is testing a critical inflection, trading at 317.69, roughly 1.81% below its rising 200-SMA (323.56) after breaking down from the 50-SMA at 366.06. With trade-quality scoring 92.4 and technical-inflection at 69.3, the reclaim-or-reject decision at the 200-day defines the next swing.
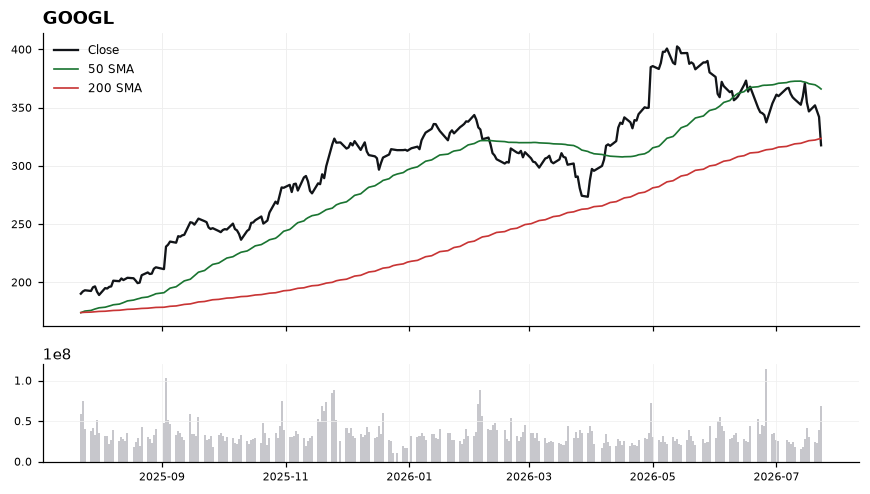
Price has lost the 200-SMA (323.56), a structural shift confirmed by MACD at -6.33 well below its signal at -3.34, indicating accelerating downside momentum. RSI(14) at 31.02 sits at the edge of oversold, suggesting a short-term bounce is possible but not yet a reversal signal. The 48-point gap between price and the 50-SMA (366.06) underscores how extended the breakdown has become, keeping the tape technically bearish until the 200-SMA is reclaimed on a closing basis.
EntryPreferred short trigger on a failed retest of the 200-SMA in the 322-326 zone, or on a fresh breakdown below 315 confirming continuation.
InvalidationInvalidation on a daily close above 330; reclaiming the 200-SMA with authority would neutralize the bearish thesis and open the path back toward the 50-SMA.
TargetsFirst target 305 (measured continuation below the 200-SMA breakdown) → Second target 292 (extension zone if momentum expands and RSI trends sub-30)
TimeframeSwing (2-6 weeks)
Ranked by technical inflection, profit-probability, and trade quality. Educational only. Not financial advice.